Medical Equipment Maintenance Market

Medical Equipment Maintenance Market Size, Share & Trends by Device (Imaging (MRI, CT, ultrasound, X-ray), ventilator), Provider (OEM, ISO, In-house), Service (Preventive, Corrective), User (Hospital, Diagnostic Center), Contract (Basic, Customized) - Global Forecast to 2029

Report Code: MD 4027 Jun, 2024, by marketsandmarkets.com

Medical Equipment Maintenance Market Size, Share & Trends

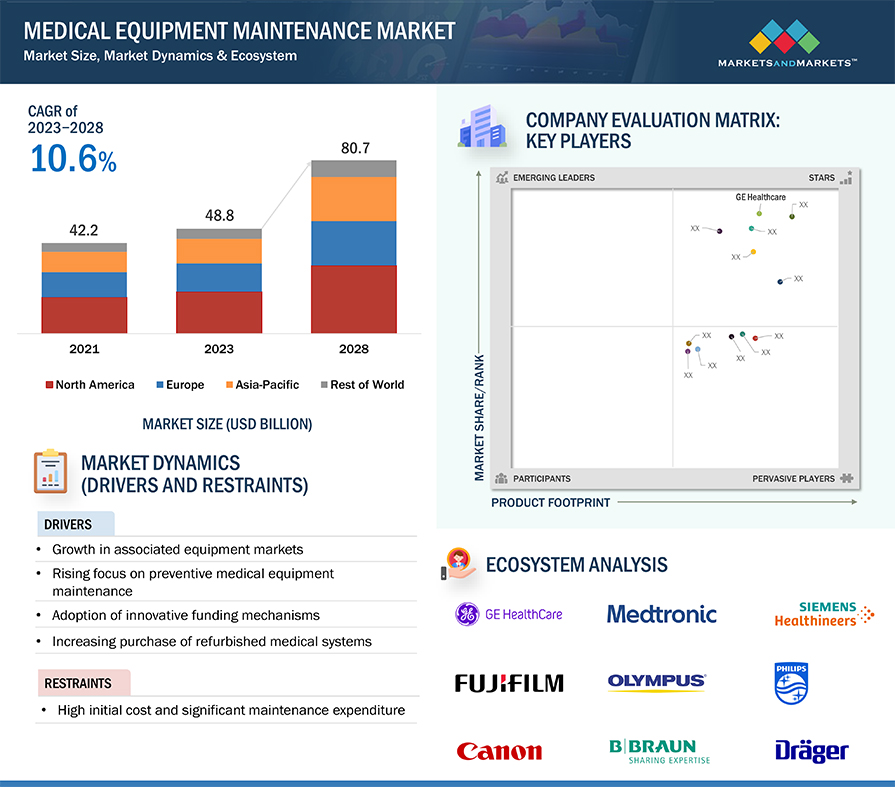
The size of global medical equipment maintenance market in terms of revenue was estimated to be worth $54.0 billion in 2024 and is poised to reach $88.9 billion by 2029, growing at a CAGR of 10.5% from 2024 to 2029. The comprehensive research encompasses an exhaustive examination of industry trends, meticulous pricing analysis, patent scrutiny, insights derived from conferences and webinars, identification of key stakeholders, and a nuanced understanding of market purchasing dynamics.

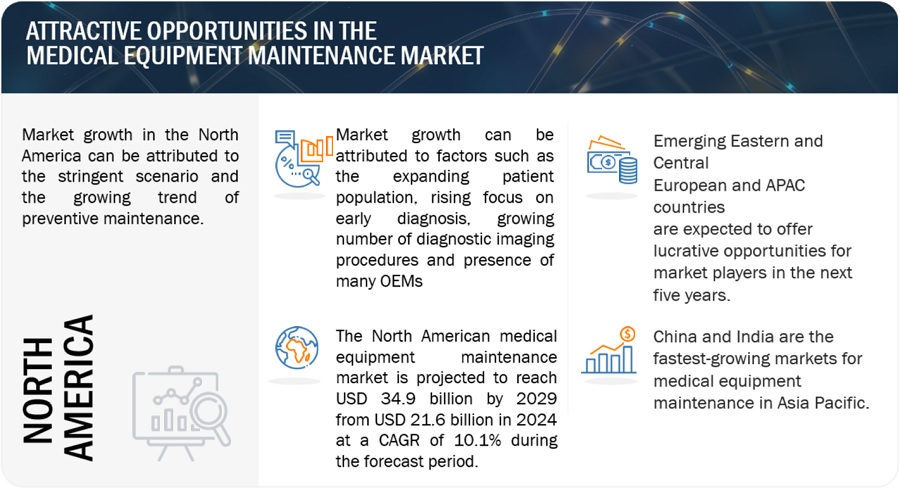
Healthcare facilities are progressively implementing preventive maintenance programs to proactively address potential equipment issues before they result in unexpected failures. By regularly inspecting, servicing, and calibrating medical devices, these programs aim to ensure continuous operation and minimize the risk of downtime, which is crucial for maintaining high standards of patient care and safety. Preventive maintenance not only extends the lifespan of medical equipment but also enhances its reliability and performance. This strategic approach to equipment management is becoming more prevalent as healthcare providers recognize the cost-effectiveness and operational benefits of preventing problems rather than reacting to them. Consequently, the adoption of preventive maintenance programs is significantly driving the demand for maintenance services, as facilities seek to optimize their equipment's functionality and avoid disruptions in critical healthcare services. Economic fluctuations and uncertainties can impact healthcare budgets and spending on equipment maintenance which can impede the market growth.

Medical Equipment Maintenance Market Trends
Medical Equipment Maintenance  Market

To know about the assumptions considered for the study, Request for Free Sample Report
Medical Equipment Maintenance  Market

e- Estimated; p- Projected

Medical Equipment Maintenance Industry Dynamics

Driver: Growth in medical equipment markets

The global market for various medical equipment is expanding, driven by the imperative to provide safer, more efficient, and high-quality healthcare. Significant innovations within the sector further propel this growth. Patients increasingly prefer technologically advanced medical devices due to improved financial affordability and accessible market entry points. These devices are distributed through both direct sales and indirect channels, such as e-commerce platforms and third-party providers, facilitated by an expanded delivery infrastructure and a comprehensive distribution network.

In major developed countries, public health insurance policies and government agencies cover medical reimbursements for healthcare procedures, thereby enhancing the adoption of medical devices. Additionally, heightened market competition and localized manufacturing in emerging economies have led to a continuous reduction in the average prices of medical devices by global manufacturers. This trend has made medical devices more affordable and readily available, driving significant demand growth during the forecast period..

Restraint: High initial cost and significant maintenance expenditure

Maintenance programs for medical devices enable healthcare providers to effectively track and monitor equipment conditions, ensuring optimal utilization and maximum uptime. This is particularly crucial in the current climate, which emphasizes preventive maintenance and managing costs amid austerity measures. These programs often involve the implementation of asset management solutions that leverage advanced technologies.

However, the deployment of these solutions entails substantial initial installation costs and ongoing maintenance expenses. Additionally, the installation of advanced medical equipment requires an annual service contract fee, approximately 12% of the equipment's cost. Over the equipment's lifespan, the cumulative service costs typically exceed the initial purchase price. The significant expenses associated with both the acquisition and maintenance of advanced medical equipment have deterred many end users from adopting these technologies.

Opportunity: Emergence of independent service organizations

The medical equipment maintenance and services sector was initially dominated by original equipment manufacturers (OEMs). However, OEMs typically charge more and take longer for maintenance, leading to higher costs and extended downtime. Amid ongoing austerity measures and the need for cost reduction in global healthcare systems, this has paved the way for the rise of Independent Service Organizations (ISOs) dedicated solely to providing maintenance services.

ISOs, staffed by expert teams, offer solutions where OEMs often fall short in terms of efficiency and satisfaction. These organizations service multiple brands of medical devices, providing end users with a centralized, independent management platform that ensures consistent service delivery across all asset groups while significantly reducing maintenance costs. This approach also lowers operating expenses and capital expenditures. Hospitals and patient advocacy groups report that ISOs typically charge 30-50% less than OEMs for equipment maintenance and repairs.

Additionally, competition among third-party service companies and insurance brokers has driven down response times and service costs. ISO contracts have become highly flexible, with negotiable terms for parameters such as response times and spare part costs, whether included in a fixed price or charged separately. Given these advantages over OEMs, ISOs are increasingly preferred by end users. The opportunities within the ISO market are expected to attract numerous companies to this sector in the coming years.

Challenge: Survival of small players in highly fragmented and competitive market

The global market is highly fragmented and competitive, encompassing a wide array of players, from multinational corporations to small local entities. The substantial capital required to retain skilled biomedical engineers, manage the logistics of medical devices, and navigate regulatory approvals poses significant challenges for many companies, particularly startups and small organizations, in sustaining their presence in the industry.

To gain a competitive edge, companies are increasingly focused on developing advanced and improved technologies. Some have also prioritized acquisitions and partnerships to enhance their market sustainability, expertise, and technological capabilities. This has created a highly competitive and dynamic environment, making it difficult for smaller companies to survive.

With numerous service providers offering similar services, cost becomes a critical factor for end users in vendor selection. Service providers face the challenge of delivering high-quality services at a lower cost. The rise of Independent Service Organizations (ISOs) has further pressured OEMs to reduce their service contract prices. In this competitive landscape, maintaining market viability is challenging, prompting many larger companies to pursue consolidation. However, smaller companies often lack this option, adversely impacting their long-term survival in the global market.

Medical Equipment Maintenance Market Ecosystem:

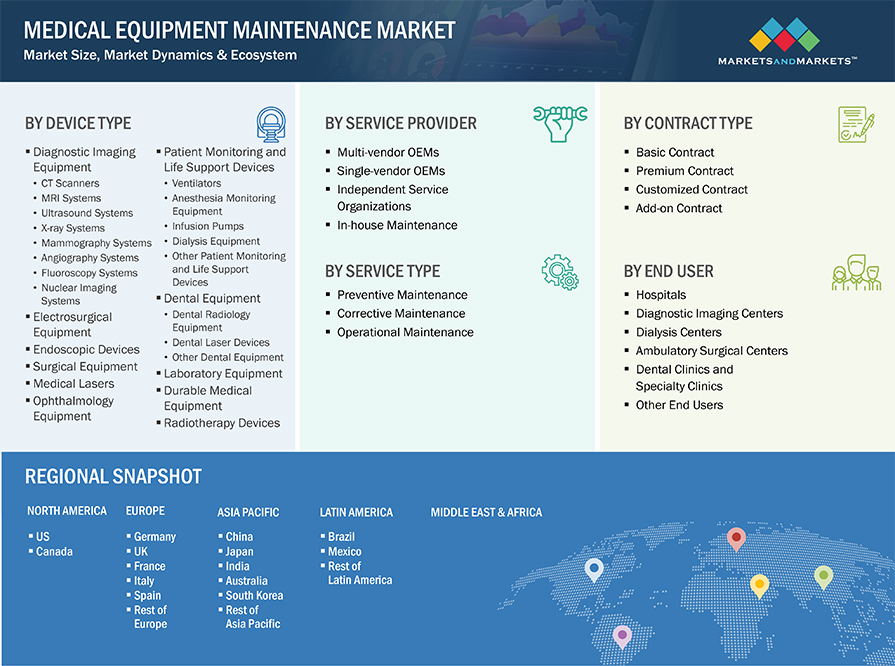
Leading players in this market include well-established and financially stable service providers of medical equipments. These companies have been operating in the market for several years and possess a diversified product portfolio, advanced technologies, and strong global presence. Prominent companies in this market include Siemens Healthineers (Germany), GE Healthcare Technologies Inc. (US), Medtronic plc (Ireland), Koninklijke Philips N.V. (Netherlands), and FUJIFILM Holdings Corporation (Japan).
Medical Equipment Maintenance  Market Ecosystem

By device type, the diagnostic imaging equipment segment accounted for the largest share of the medical equipment maintenance industry in 2023

Segmented by device type, the medical equipment maintenance market encompasses diagnostic imaging equipment, surgical equipment, dental equipment, radiotherapy devices, patient monitoring & life support devices, endoscopic devices, laboratory equipment, ophthalmology equipment, medical lasers, electrosurgical equipment, radiotherapy devices, and durable medical equipment. Notably, in 2023, the diagnostic imaging equipment segment commanded the largest market share. The rapid evolution of technology in this sector necessitates frequent upgrades and updates to remain competitive, consequently driving demand for maintenance services. This dynamic landscape underscores the imperative of staying current with technological advancements to maintain relevance and efficacy in the market. With the emergence of newer and more advanced imaging technologies, healthcare facilities are compelled to invest in maintenance services to optimize equipment performance and lifespan. This enables them to deliver enhanced diagnostic capabilities and uphold their competitive positioning within the industry.

By service provider, the multi-vendor OEMs segment commanded for the largest share of the medical equipment maintenance industry in 2023

Segmented by service provider, the medical equipment maintenance market is delineated into multi-vendor OEMs, single-vendor OEMs, ISOS, and in-house maintenance. Notably, the multi-vendor OEMs segment holds the dominant share of the global market. These service providers deliver customized maintenance solutions meticulously designed to align with the unique requirements and financial parameters of healthcare institutions. This bespoke approach ensures that the maintenance plans cater precisely to the facilities' needs while adhering to budget constraints. Furthermore, these providers offer flexibility in both service scheduling and contract terms, allowing for adjustments and accommodations as necessitated by the evolving demands of the healthcare environment. This tailored approach enhances operational efficiency and cost-effectiveness while maintaining the reliability and longevity of critical medical equipment.

By service type, the preventive maintenance segment of the medical equipment maintenance industry is expected to witness significant growth during the forecast period

Segmented on service type, the medical equipment maintenance market is segmented into operational, corrective, and preventive maintenance. Forecasted growth is anticipated particularly within the preventive maintenance segment. This growth trajectory is attributed to the proactive benefits associated with preventive maintenance practices. By implementing preventive maintenance protocols, healthcare facilities cultivate a culture of continuous improvement. This approach encourages proactive problem-solving, facilitates knowledge sharing, and enables the refinement and optimization of maintenance strategies over time. Consequently, healthcare facilities can enhance operational efficiency, minimize downtime, and ensure the sustained reliability and performance of critical medical equipment assets.

By End User, the hospitals segment accounted for the largest share of the medical equipment maintenance industry in 2023

Segmented by end users, the medical equipment maintenance market is segmented into hospitals, diagnostics imaging centers, dialysis centers, ambulatory surgical centers, dental clinics & speciality clinics and other end users. Hospitals are actively involved in ongoing improvement endeavors geared towards maximizing operational efficiency, cutting costs, and elevating the quality of patient care. Within this framework, maintenance services serve as a crucial enabler by guaranteeing the dependability, effectiveness, and durability of medical equipment assets. These services play an integral role in sustaining the hospital's operational integrity, enabling seamless healthcare delivery, and ultimately contributing to the enhancement of patient outcomes and satisfaction.

By Contract type, the premium contract segment accounted for the largest share of the medical equipment maintenance industry in 2023

Segmented by contract type, the medical equipment maintenance market is segmented into basic contract, premium contract, customized contract, and add-on contract. The premium contract segment holds the largest share in the global market. Healthcare facilities often face budgetary limitations that shape their preferences regarding maintenance services. Premium contracts can be customized to accommodate these financial constraints by providing adaptable pricing models, flexible payment terms, and cost-effective strategies tailored to the facility's specific financial objectives and limitations. This bespoke approach ensures that maintenance services remain accessible and aligned with the facility's budgetary parameters, enabling efficient management of healthcare assets while optimizing cost-effectiveness and operational efficiency.

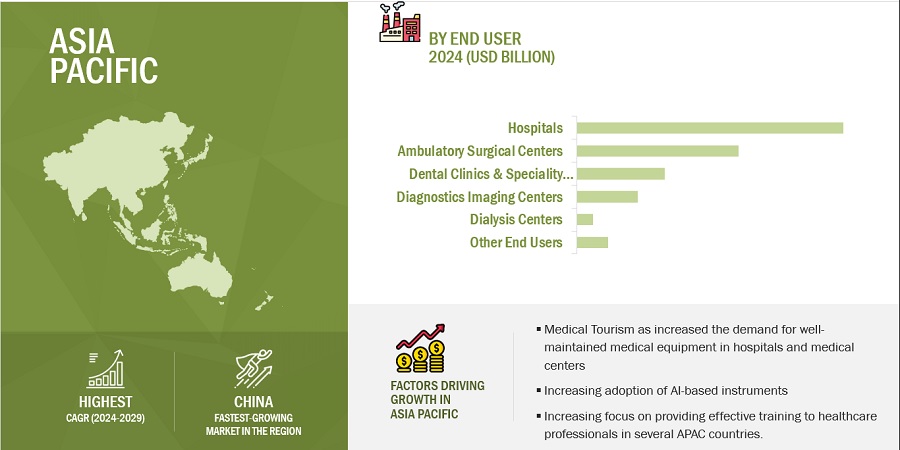
APAC is estimated to be the fastest-growing regional market during the forecast period of the medical equipment maintenance industry
Medical Equipment Maintenance  Market by Region

To know about the assumptions considered for the study, download the pdf brochure

The medical equipment maintenance market has been segmented into five major regions, namely, North America, Europe, the Asia Pacific, Latin America, and the Middle East & Africa. Governments across the Asia Pacific region are implementing healthcare reforms and initiatives to improve access to quality healthcare services. This includes investments in medical equipment maintenance infrastructure to enhance the reliability and efficiency of healthcare delivery systems. The Asia Pacific region has emerged as a popular destination for medical tourism, attracting patients from around the world seeking affordable and high-quality healthcare services. This influx of medical tourists has increased the demand for well-maintained medical equipment in hospitals and medical centers. The aforementioned factors will drive the growth of the market in this region.

Key players in this market include Siemens Healthineers (Germany), GE Healthcare Technologies Inc. (US), Medtronic plc (Ireland), Koninklijke Philips N.V. (Netherlands), FUJIFILM Holdings Corporation (Japan), Olympus Corporation (Japan), Stryker Corporation (US), Canon Inc (Japan), Drägerwerk AG & Co. KGaA (Germany), Hitachi, Ltd (Japan), B. Braun SE (Germany), Elekta (Sweden), Shimadzu Corporation (Japan), Althea Group (Italy), Agfa-Gevaert N.V. (Belgium), BCAS Bio-medical Services Ltd. (UK), Agenor Mantenimientos (Spain), Grupo Empresarial Electromédico (Spain), Carestream Healthv (US), Karl Storz Gmbh & Co. Kg (Germany), STERIS Plc (US), Avensys UK Ltd. (UK), The Intermed Group (US), Crothall Healthcare (US), and Trimedx Holdings LLC (US).

Scope of the Medical Equipment Maintenance Industry

Report Metric

Details

Market Revenue in 2024

$54.0 billion

Projected Revenue by 2029

$88.9 billion

Revenue Rate

Poised to Grow at a CAGR of 10.5%

Market Driver

Growth in medical equipment markets

Market Opportunity

Emergence of independent service organizations

This report has segmented the global medical equipment maintenance market to forecast revenue and analyze trends in each of the following submarkets:

By Device Type
  • Diagnostic Imaging Equipment
  • CT Scanners
  • MRI Systems
  • Ultrasound Systems
  • X-Ray Systems
  • Mammography Systems
  • Angiography Systems
  • Fluoroscopy Systems
  • Nuclear Imaging Equipment (PET/SPECT)
  • Electrosurgical Equipment
  • Endoscopic Devices
  • Surgical Equipment
  • Medical Lasers
  • Ophthalmology Equipment
  • Patient Monitoring & Life Support Devices
  • Ventilators
  • Anesthesia Monitoring Equipment
  • Infusion Pumps
  • Dialysis Equipment
  • Other Life-Supported Devices & Patient Monitoring Devices
  • Dental Equipment
  • Dental Radiology Equipment
  • Dental Laser Devices
  • Other Dental Equipment
  • Laboratory Equipment
  • Durable Medical Equipment
  • Radiotherapy Devices
By Service Type
  • Preventive Maintenance
  • Corrective Maintenance
  • Operational Maintenance
By Service Provider
  • Multi-Vendor OEMs
  • Single-Vendor OEMs
  • Independent Service Organization
  • In-House Maintenance
By End User
  • Hospitals
  • Diagnostic Imaging Centers
  • Dialysis Centers
  • Ambulatory Surgical Centers
  • Dental Clinics & Specialty Clinics
  • Other End Users
By Contract Type
  • Basic Contract
  • Premium Contract
  • Customized Contract
  • Add-On Contract
By Region
  • North America
    • US
    • Canada
  • Europe
    • Germany
    • France
    • UK
    • Italy
    • Spain
    • Rest of Europe
  • Asia Pacific
    • Japan
    • China
    • India
    • Australia
    • South Korea
    • Rest of Asia Pacific
  • Latin America
    • Brazil
    • Mexico
    • Rest of Latin America
  • Middle East & Africa
    • GCC Countries
    • Rest of MEA

Recent Developments of the Medical Equipment Maintenance Industry:

  • In October 2023, GE Healthcare and reLink Medical announced a collaboration to deliver asset management solutions aimed at helping healthcare providers minimize medical device waste, increase operational efficiency, and maximize equipment utilization. This partnership will assist healthcare providers in managing their end-of-life medical equipment and offer potential benefits for optimizing their resources.
  • In May 2023, Siemens Healthineers and CommonSpirit Health acquired Block Imaging. This acquisition aims to offer more sustainable options and meet the growing demand from U.S. hospitals, health systems, and other care sites for multi-vendor imaging parts and services.
  • In April 2023, Koninklijke Philips collaborated with Amazon Web Services (AWS). This collaboration supports the development and deployment of generative AI applications. Both Philips and AWS provide migration expertise and planning services, total cost-of-ownership analysis, and cybersecurity technical expertise to enable an easy migration from on-premises to cloud-based solutions for customers.

Frequently Asked Questions (FAQ):

To speak to our analyst for a discussion on the above findings, click Speak to Analyst

TABLE OF CONTENTS
 
1 INTRODUCTION (Page No. - 45)
    1.1 STUDY OBJECTIVES 
    1.2 MARKET DEFINITION 
           1.2.1 INCLUSIONS & EXCLUSIONS
    1.3 STUDY SCOPE 
           1.3.1 MARKETS COVERED
           1.3.2 YEARS CONSIDERED
    1.4 CURRENCY CONSIDERED 
          TABLE 1 STANDARD CURRENCY CONVERSION RATES
    1.5 KEY STAKEHOLDERS 
    1.6 SUMMARY OF CHANGES 
    1.7 RECESSION IMPACT 
 
2 RESEARCH METHODOLOGY (Page No. - 51)
    2.1 RESEARCH DATA 
          FIGURE 1 RESEARCH DESIGN
           2.1.1 SECONDARY DATA
                    2.1.1.1 Indicative list of secondary sources
           2.1.2 PRIMARY DATA
                    FIGURE 2 BREAKDOWN OF PRIMARY INTERVIEWS: BY COMPANY TYPE, DESIGNATION, AND REGION
                    FIGURE 3 PRIMARY SOURCES: GLOBAL MEDICAL EQUIPMENT MAINTENANCE MARKET
    2.2 MARKET SIZE ESTIMATION & FORECAST 
          FIGURE 4 RESEARCH METHODOLOGY: HYPOTHESIS BUILDING
           2.2.1 REVENUE MAPPING-BASED MARKET ESTIMATION
                    FIGURE 5 MARKET SIZE ESTIMATION: REVENUE SHARE ANALYSIS (2023)
                    FIGURE 6 MARKET SIZE ESTIMATION: COMPANY-WISE REVENUE SHARE ANALYSIS (2023)
           2.2.2 END USER-BASED MARKET ESTIMATION
                    FIGURE 7 MARKET SIZE ESTIMATION METHODOLOGY: MEDICAL EQUIPMENT MAINTENANCE INDUSTRY
           2.2.3 GROWTH FORECAST
                    FIGURE 8 IMPACT OF DRIVERS, RESTRAINTS, OPPORTUNITIES, AND CHALLENGES ON MARKET GROWTH AND CAGR
           2.2.4 PRIMARY RESEARCH VALIDATION
    2.3 IMPACT OF ECONOMIC RECESSION ON MARKET 
           2.3.1 METHODOLOGY TO ANALYZE IMPACT OF RECESSION ON MARKET
    2.4 MARKET ESTIMATION & DATA TRIANGULATION 
          FIGURE 9 DATA TRIANGULATION METHODOLOGY
    2.5 STUDY ASSUMPTIONS 
    2.6 RESEARCH LIMITATIONS 
 
3 EXECUTIVE SUMMARY (Page No. - 65)
    FIGURE 10 MEDICAL EQUIPMENT MAINTENANCE MARKET, BY DEVICE TYPE,  2024 VS. 2029 (USD MILLION)
    FIGURE 11 MEDICAL EQUIPMENT MAINTENANCE INDUSTRY, BY SERVICE TYPE,  2024 VS. 2029 (USD MILLION)
    FIGURE 12 MARKET, BY SERVICE PROVIDER,  2024 VS. 2029 (USD MILLION)
    FIGURE 13 MARKET, BY CONTRACT TYPE,  2024 VS. 2029 (USD MILLION)
    FIGURE 14 MARKET, BY END USER,  2024 VS. 2029 (USD MILLION)
    FIGURE 15 GEOGRAPHICAL SNAPSHOT OF MARKET
 
4 PREMIUM INSIGHTS (Page No. - 70)
    4.1 MEDICAL EQUIPMENT MAINTENANCE MARKET OVERVIEW 
          FIGURE 16 GROWING TREND OF PREVENTIVE MAINTENANCE TO DRIVE MARKET GROWTH IN NEXT FIVE YEARS
    4.2 EUROPE: MEDICAL EQUIPMENT MAINTENANCE INDUSTRY FOR DIAGNOSTIC IMAGING EQUIPMENT, BY SERVICE TYPE AND COUNTRY 
          FIGURE 17 PREVENTIVE MAINTENANCE TO FORM LARGEST SERVICE TYPE SEGMENT IN MARKET
    4.3 MARKET SHARE,  BY SERVICE PROVIDER 
          FIGURE 18 MULTI-VENDOR OEMS FORM LARGEST SERVICE PROVIDER SEGMENT IN MARKET
    4.4 MARKET SHARE,  BY END USER 
          FIGURE 19 HOSPITALS TO DOMINATE MARKET DURING FORECAST PERIOD
    4.5 MARKET: GEOGRAPHICAL GROWTH OPPORTUNITIES 
          FIGURE 20 CHINA TO REGISTER HIGHEST CAGR DURING FORECAST PERIOD
 
5 MARKET OVERVIEW (Page No. - 74)
    5.1 INTRODUCTION 
    5.2 MARKET DYNAMICS 
          FIGURE 21 MEDICAL EQUIPMENT MAINTENANCE MARKET: DRIVERS, RESTRAINTS, OPPORTUNITIES, AND CHALLENGES
           5.2.1 DRIVERS
                    5.2.1.1 Growth in medical equipment markets
                                FIGURE 22 EU: DISTRIBUTION OF POPULATION, BY AGE (2010 VS. 2020 VS. 2030)
                                FIGURE 23 GLOBAL PERCENTAGE OF GERIATRIC POPULATION, BY COUNTRY  (2010 VS. 2019 VS. 2022)
                                TABLE 2 COUNTRY-WISE CANCER INCIDENCE PER MILLION POPULATION, BY COUNTRY,  2015–2019
                                FIGURE 24 COUNTRY-WISE INCIDENCE OF CANCER, BY COUNTRY, 2022
                                TABLE 3 GLOBAL DIABETIC POPULATION AND DIABETES-RELATED HEALTHCARE EXPENDITURE
                                FIGURE 25 EUROPE: TOTAL NUMBER OF MINIMALLY INVASIVE PROCEDURES, BY COUNTRY, 2021
                    5.2.1.2 Rising focus on preventive medical equipment maintenance
                    5.2.1.3 Adoption of innovative funding mechanisms
                                TABLE 4 BENEFICIARIES OF NHS WALES INVESTMENT IN NEW DIAGNOSTIC IMAGING EQUIPMENT
                    5.2.1.4 Increasing purchase of refurbished medical systems
                                TABLE 5 REGULATIONS ON IMPORT AND USE OF REFURBISHED MEDICAL EQUIPMENT
           5.2.2 RESTRAINTS
                    5.2.2.1 High initial cost and significant maintenance expenditure
                    5.2.2.2 Fiscal unsustainability due to wasteful spending
           5.2.3 OPPORTUNITIES
                    5.2.3.1 Innovation in service offerings and use of IoT
                    5.2.3.2 Emergence of independent service organizations
                    5.2.3.3 Growing medical device sector in emerging economies across Central and Eastern Europe and Asia Pacific
           5.2.4 CHALLENGES
                    5.2.4.1 Survival of small players in highly fragmented and competitive market
                    5.2.4.2 Compliance issues with New Medical Device Regulation guidelines and Golden Rule
                    5.2.4.3 Dearth of skilled technicians and biomedical engineers
    5.3 INDUSTRY TRENDS 
           5.3.1 PREFERENCE FOR MULTI-VENDOR CONTRACTS
           5.3.2 CONSOLIDATION OF DIALYSIS CENTERS AND HOSPITALS
                    TABLE 6 PROMINENT ACQUISITIONS IN DIALYSIS SERVICES INDUSTRY
           5.3.3 EQUIPMENT SERVICE PROVIDERS AND GROUP PURCHASING
                    FIGURE 26 DEVIATION FROM GOLDEN RULE, BY COUNTRY, 2020
           5.3.4 EQUIPMENT MAINTENANCE INSURANCE TOOLS FOR IMAGING CENTERS
    5.4 REGULATORY LANDSCAPE 
           5.4.1 REGULATORY BODIES, GOVERNMENT AGENCIES, AND OTHER ORGANIZATIONS
                    TABLE 7 NORTH AMERICA: REGULATORY BODIES, GOVERNMENT AGENCIES, AND OTHER ORGANIZATIONS
                    TABLE 8 EUROPE: REGULATORY BODIES, GOVERNMENT AGENCIES, AND OTHER ORGANIZATIONS
                    TABLE 9 ASIA PACIFIC: REGULATORY BODIES, GOVERNMENT AGENCIES, AND OTHER ORGANIZATIONS
                    TABLE 10 LATIN AMERICA: REGULATORY BODIES, GOVERNMENT AGENCIES, AND OTHER ORGANIZATIONS
                    TABLE 11 MIDDLE EAST & AFRICA: REGULATORY BODIES, GOVERNMENT AGENCIES, AND OTHER ORGANIZATIONS
           5.4.2 REGULATORY SCENARIO
                    5.4.2.1 North America
                               5.4.2.1.1 US
                    5.4.2.2 Europe
           5.4.3 REGULATORY STANDARDS
                    5.4.3.1 ISO standards
                    5.4.3.2 ISO 9001:2015
                    5.4.3.3 ISO 13485:2016
    5.5 VALUE CHAIN ANALYSIS 
          FIGURE 27 VALUE CHAIN ANALYSIS: MAXIMUM VALUE ADDED DURING MANUFACTURING PHASE
          FIGURE 28 VALUE CHAIN: GLOBAL MEDICAL EQUIPMENT MAINTENANCE WORKFLOW
    5.6 SUPPLY CHAIN ANALYSIS 
          TABLE 12 MEDICAL EQUIPMENT MAINTENANCE INDUSTRY: SUPPLY CHAIN ECOSYSTEM
    5.7 ECOSYSTEM ANALYSIS 
    5.8 PATENT ANALYSIS 
           5.8.1 PATENT PUBLICATION TRENDS FOR MARKET
                    FIGURE 29 GLOBAL NUMBER OF PATENT PUBLICATIONS (JANUARY 2013–APRIL 2024)
           5.8.2 INSIGHTS: JURISDICTION AND TOP APPLICANT ANALYSIS
                    FIGURE 30 TOP APPLICANTS & OWNERS (COMPANIES/INSTITUTIONS) FOR DIALYSIS MACHINE PATENTS (JANUARY 2013–APRIL 2024)
    5.9 PRICING ANALYSIS 
          TABLE 13 AVERAGE PRICE OF PREVENTIVE MAINTENANCE SERVICES FOR IMAGING SYSTEMS IN 2022, BY COUNTRY (USD)
          TABLE 14 AVERAGE SELLING PRICE OF PREVENTIVE MAINTENANCE SERVICES FOR MEDICAL DEVICES IN 2022, BY KEY PLAYER (USD)
    5.10 TRADE DATA ANALYSIS 
           5.10.1 TRADE ANALYSIS FOR ELECTRO-DIAGNOSTIC SYSTEMS
                     TABLE 15 IMPORT DATA FOR ELECTRO-DIAGNOSTIC SYSTEMS (HS CODE 901819), BY COUNTRY, 2019–2023 (USD THOUSAND)
                     TABLE 16 EXPORT DATA FOR ELECTRO-DIAGNOSTIC SYSTEMS (HS CODE 901819), BY COUNTRY, 2019–2023 (USD THOUSAND)
           5.10.2 TRADE ANALYSIS FOR ULTRASOUND SYSTEMS
                     TABLE 17 IMPORT DATA FOR ULTRASOUND SYSTEMS (HS CODE 901812), BY COUNTRY,  2019–2023 (USD THOUSAND)
                     TABLE 18 EXPORT DATA FOR ULTRASOUND SYSTEMS (HS CODE 901812), BY COUNTRY,  2019–2023 (USD THOUSAND)
           5.10.3 TRADE ANALYSIS FOR MAGNETIC RESONANCE IMAGING SYSTEMS
                     TABLE 19 IMPORT DATA FOR MAGNETIC RESONANCE IMAGING SYSTEMS (HS CODE 901813),  BY COUNTRY, 2019–2023 (USD THOUSAND)
                     TABLE 20 EXPORT DATA FOR MAGNETIC RESONANCE IMAGING SYSTEMS (HS CODE 901813),  BY COUNTRY, 2019–2023 (USD THOUSAND)
           5.10.4 TRADE ANALYSIS FOR X-RAY SYSTEMS
                     TABLE 21 IMPORT DATA FOR X-RAY SYSTEMS (HS CODE 902214), BY COUNTRY,  2019–2023 (USD THOUSAND)
                     TABLE 22 EXPORT DATA FOR X-RAY SYSTEMS (HS CODE 902214), BY COUNTRY,  2019–2023 (USD THOUSAND)
    5.11 PORTER’S FIVE FORCE ANALYSIS 
           TABLE 23 PORTER’S FIVE FORCES ANALYSIS
           5.11.1 THREAT OF NEW ENTRANTS
           5.11.2 THREAT OF SUBSTITUTES
           5.11.3 BARGAINING POWER OF SUPPLIERS
           5.11.4 BARGAINING POWER OF BUYERS
           5.11.5 INTENSITY OF COMPETITIVE RIVALRY
    5.12 CASE STUDY ANALYSIS 
           TABLE 24 CASE STUDY: PROVIDING TRAINING AND EDUCATION AND KEEPING UP WITH EVOLVING ULTRASOUND TECHNIQUES
    5.13 KEY CONFERENCES & EVENTS (2024–2025) 
           TABLE 25 LIST OF MAJOR CONFERENCES & EVENTS IN 2024–2025
    5.14 KEY STAKEHOLDERS & BUYING CRITERIA 
           5.14.1 KEY STAKEHOLDERS IN BUYING PROCESS, BY END USER
                     FIGURE 31 INFLUENCE OF STAKEHOLDERS ON BUYING PROCESS, BY END USER
                     TABLE 26 INFLUENCE OF STAKEHOLDERS ON BUYING PROCESS, BY END USER (%)
           5.14.2 BUYING CRITERIA
                     FIGURE 32 KEY BUYING CRITERIA, BY END USER
                     TABLE 27 KEY BUYING CRITERIA, BY END USER
    5.15 INVESTMENT & FUNDING SCENARIO 
           FIGURE 33 INVESTMENT & FUNDING SCENARIO FOR MARKET PLAYERS
 
6 MEDICAL EQUIPMENT MAINTENANCE MARKET, BY DEVICE TYPE (Page No. - 110)
    6.1 INTRODUCTION 
          TABLE 28 MEDICAL EQUIPMENT MAINTENANCE INDUSTRY, BY DEVICE TYPE,  2022–2029 (USD MILLION)
    6.2 DIAGNOSTIC IMAGING EQUIPMENT 
          TABLE 29 LEADING VENDORS OFFERING MAINTENANCE SERVICES FOR DIAGNOSTIC IMAGING EQUIPMENT
          TABLE 30 MARKET FOR DIAGNOSTIC IMAGING EQUIPMENT,  BY TYPE, 2022–2029 (USD MILLION)
          TABLE 31 MARKET FOR DIAGNOSTIC IMAGING EQUIPMENT,  BY SERVICE PROVIDER, 2022–2029 (USD MILLION)
          TABLE 32 MARKET FOR DIAGNOSTIC IMAGING EQUIPMENT,  BY SERVICE TYPE, 2022–2029 (USD MILLION)
          TABLE 33 MARKET FOR DIAGNOSTIC IMAGING EQUIPMENT,  BY END USER, 2022–2029 (USD MILLION)
          TABLE 34 MARKET FOR DIAGNOSTIC IMAGING EQUIPMENT,  BY CONTRACT TYPE, 2022–2029 (USD MILLION)
          TABLE 35 MARKET FOR DIAGNOSTIC IMAGING EQUIPMENT,  BY REGION, 2022–2029 (USD MILLION)
           6.2.1 MRI SYSTEMS
                    6.2.1.1 Increasing demand for MRI procedures among patients to drive segment
                                FIGURE 34 MRI EXAMS PER 1,000 POPULATION, BY COUNTRY (2021)
                                TABLE 36 MARKET FOR MRI SYSTEMS, BY REGION,  2022–2029 (USD MILLION)
           6.2.2 CT SCANNERS
                    6.2.2.1 Increasing prevalence of chronic diseases and growing emphasis on maintaining state-of-the-art CT systems to drive market
                                TABLE 37 MARKET FOR CT SCANNERS, BY REGION,  2022–2029 (USD MILLION)
           6.2.3 X-RAY SYSTEMS
                    6.2.3.1 Growing demand for OEM-based X-ray maintenance services to favor market growth
                                TABLE 38 MARKET FOR X-RAY SYSTEMS, BY REGION,  2022–2029 (USD MILLION)
           6.2.4 ULTRASOUND SYSTEMS
                    6.2.4.1 Cost-effective and easy preventive maintenance measures to boost market
                                TABLE 39 MARKET FOR ULTRASOUND SYSTEMS, BY REGION, 2022–2029 (USD MILLION)
           6.2.5 ANGIOGRAPHY SYSTEMS
                    6.2.5.1 Growing obsolescence of angiography equipment to drive demand for maintenance services
                                TABLE 40 MARKET FOR ANGIOGRAPHY SYSTEMS, BY REGION, 2022–2029 (USD MILLION)
           6.2.6 MAMMOGRAPHY SYSTEMS
                    6.2.6.1 Preference for mammography over general breast ultrasound to drive market
                                TABLE 41 MARKET FOR MAMMOGRAPHY SYSTEMS,  BY REGION, 2022–2029 (USD MILLION)
           6.2.7 NUCLEAR IMAGING SYSTEMS
                    6.2.7.1 Growing prevalence of cancer and increasing development of novel radiotracers to propel growth
                                TABLE 42 MARKET FOR NUCLEAR IMAGING SYSTEMS,  BY REGION, 2022–2029 (USD MILLION)
           6.2.8 FLUOROSCOPY SYSTEMS
                    6.2.8.1 Increasing adoption of refurbished fluoroscopy equipment to fuel growth
                                TABLE 43 MARKET FOR FLUOROSCOPY SYSTEMS, BY REGION, 2022–2029 (USD MILLION)
    6.3 PATIENT MONITORING & LIFE SUPPORT DEVICES 
          TABLE 44 LEADING VENDORS OFFERING MAINTENANCE SERVICES FOR PATIENT MONITORING & LIFE SUPPORT DEVICES
          TABLE 45 MARKET FOR PATIENT MONITORING & LIFE SUPPORT DEVICES, BY TYPE, 2022–2029 (USD MILLION)
          TABLE 46 MARKET FOR PATIENT MONITORING & LIFE SUPPORT DEVICES, BY SERVICE PROVIDER, 2022–2029 (USD MILLION)
          TABLE 47 MARKET FOR PATIENT MONITORING & LIFE SUPPORT DEVICES, BY SERVICE TYPE, 2022–2029 (USD MILLION)
          TABLE 48 MARKET FOR PATIENT MONITORING & LIFE SUPPORT DEVICES, BY END USER, 2022–2029 (USD MILLION)
          TABLE 49 MARKET FOR PATIENT MONITORING & LIFE SUPPORT DEVICES, BY CONTRACT TYPE, 2022–2029 (USD MILLION)
          TABLE 50 MARKET FOR PATIENT MONITORING & LIFE SUPPORT DEVICES, BY REGION, 2022–2029 (USD MILLION)
           6.3.1 VENTILATORS
                    6.3.1.1 Increased demand for ventilators due to rising chronic diseases to boost adoption
                                TABLE 51 MARKET FOR VENTILATORS, BY REGION,  2022–2029 (USD MILLION)
           6.3.2 ANESTHESIA MONITORING EQUIPMENT
                    6.3.2.1 Stringent regulatory guidelines for anesthesia monitoring systems to aid growth
                                TABLE 52 MARKET FOR ANESTHESIA MONITORING EQUIPMENT, BY REGION, 2022–2029 (USD MILLION)
           6.3.3 DIALYSIS EQUIPMENT
                    6.3.3.1 Growing number of renal care centers to drive segment
                                TABLE 53 MARKET FOR DIALYSIS EQUIPMENT, BY REGION, 2022–2029 (USD MILLION)
           6.3.4 INFUSION PUMPS
                    6.3.4.1 Growing adoption of infusion pumps on rental basis to drive segment
                                TABLE 54 MARKET FOR INFUSION PUMPS, BY REGION, 2022–2029 (USD MILLION)
           6.3.5 OTHER PATIENT MONITORING & LIFE SUPPORT DEVICES
                    TABLE 55 LEADING VENDORS OFFERING MAINTENANCE SERVICES FOR LIFE SUPPORT DEVICES
                    TABLE 56 MARKET FOR OTHER PATIENT MONITORING & LIFE SUPPORT DEVICES, BY REGION, 2022–2029 (USD MILLION)
    6.4 ENDOSCOPIC DEVICES 
           6.4.1 INCREASING DEMAND FOR REUSABLE ENDOSCOPIC DEVICES AND GROWING NEED FOR AFFORDABLE SERVICES TO DRIVE MARKET
                    TABLE 57 LEADING VENDORS OFFERING MAINTENANCE SERVICES FOR ENDOSCOPIC DEVICES
                    TABLE 58 MARKET FOR ENDOSCOPIC DEVICES,  BY SERVICE PROVIDER, 2022–2029 (USD MILLION)
                    TABLE 59 MARKET FOR ENDOSCOPIC DEVICES,  BY SERVICE TYPE, 2022–2029 (USD MILLION)
                    TABLE 60 MARKET FOR ENDOSCOPIC DEVICES,  BY END USER, 2022–2029 (USD MILLION)
                    TABLE 61 MARKET FOR ENDOSCOPIC DEVICES,  BY CONTRACT TYPE, 2022–2029 (USD MILLION)
                    TABLE 62 MARKET FOR ENDOSCOPIC DEVICES, BY REGION, 2022–2029 (USD MILLION)
    6.5 SURGICAL EQUIPMENT 
           6.5.1 INCREASING NUMBER OF SURGERIES AND RISING GERIATRIC POPULATION TO BOOST MARKET
                    TABLE 63 LEADING VENDORS OFFERING MAINTENANCE SERVICES FOR SURGICAL EQUIPMENT
                    TABLE 64 MARKET FOR SURGICAL EQUIPMENT,  BY SERVICE PROVIDER, 2022–2029 (USD MILLION)
                    TABLE 65 MARKET FOR SURGICAL EQUIPMENT,  BY SERVICE TYPE, 2022–2029 (USD MILLION)
                    TABLE 66 MARKET FOR SURGICAL EQUIPMENT,  BY END USER, 2022–2029 (USD MILLION)
                    TABLE 67 MARKET FOR SURGICAL EQUIPMENT,  BY CONTRACT TYPE, 2022–2029 (USD MILLION)
                    TABLE 68 MARKET FOR SURGICAL EQUIPMENT, BY REGION, 2022–2029 (USD MILLION)
    6.6 OPHTHALMOLOGY EQUIPMENT 
           6.6.1 HIGH EQUIPMENT COSTS TO INCREASE FOCUS ON PREVENTIVE MAINTENANCE AMONG END USERS
                    FIGURE 35 EUROPE: CATARACT SURGERIES PER 100,000 POPULATION, BY COUNTRY (2021)
                    TABLE 69 MARKET FOR OPHTHALMOLOGY EQUIPMENT,  BY SERVICE PROVIDER, 2022–2029 (USD MILLION)
                    TABLE 70 MARKET FOR OPHTHALMOLOGY EQUIPMENT,  BY SERVICE TYPE, 2022–2029 (USD MILLION)
                    TABLE 71 MARKET FOR OPHTHALMOLOGY EQUIPMENT,  BY END USER, 2022–2029 (USD MILLION)
                    TABLE 72 MARKET FOR OPHTHALMOLOGY EQUIPMENT,  BY CONTRACT TYPE, 2022–2029 (USD MILLION)
                    TABLE 73 MARKET FOR OPHTHALMOLOGY EQUIPMENT,  BY REGION, 2022–2029 (USD MILLION)
    6.7 MEDICAL LASERS 
           6.7.1 HIGH RECURRING COSTS OF EQUIPMENT MAINTENANCE TO LIMIT MARKET
                    TABLE 74 MARKET FOR MEDICAL LASERS,  BY SERVICE PROVIDER, 2022–2029 (USD MILLION)
                    TABLE 75 MARKET FOR MEDICAL LASERS, BY SERVICE TYPE, 2022–2029 (USD MILLION)
                    TABLE 76 MARKET FOR MEDICAL LASERS, BY END USER,  2022–2029 (USD MILLION)
                    TABLE 77 MARKET FOR MEDICAL LASERS,  BY CONTRACT TYPE, 2022–2029 (USD MILLION)
                    TABLE 78 MARKET FOR MEDICAL LASERS, BY REGION,  2022–2029 (USD MILLION)
    6.8 ELECTROSURGICAL EQUIPMENT 
           6.8.1 HIGH COST OF PURCHASING NEW ELECTROSURGERY DEVICES TO DRIVE MARKET
                    TABLE 79 MARKET FOR ELECTROSURGICAL EQUIPMENT,  BY SERVICE PROVIDER, 2022–2029 (USD MILLION)
                    TABLE 80 MARKET FOR ELECTROSURGICAL EQUIPMENT,  BY SERVICE TYPE, 2022–2029 (USD MILLION)
                    TABLE 81 MARKET FOR ELECTROSURGICAL EQUIPMENT,  BY END USER, 2022–2029 (USD MILLION)
                    TABLE 82 MARKET FOR ELECTROSURGICAL EQUIPMENT,  BY CONTRACT TYPE, 2022–2029 (USD MILLION)
                    TABLE 83 MARKET FOR ELECTROSURGICAL EQUIPMENT,  BY REGION, 2022–2029 (USD MILLION)
    6.9 RADIOTHERAPY DEVICES 
           6.9.1 STRINGENT REGULATORY GUIDELINES TO SUPPORT DEMAND FOR PREVENTIVE MAINTENANCE
                    TABLE 84 MARKET FOR RADIOTHERAPY DEVICES,  BY SERVICE PROVIDER, 2022–2029 (USD MILLION)
                    TABLE 85 MARKET FOR RADIOTHERAPY DEVICES,  BY SERVICE TYPE, 2022–2029 (USD MILLION)
                    TABLE 86 MARKET FOR RADIOTHERAPY DEVICES,  BY END USER, 2022–2029 (USD MILLION)
                    TABLE 87 MARKET FOR RADIOTHERAPY DEVICES,  BY CONTRACT TYPE, 2022–2029 (USD MILLION)
                    TABLE 88 MARKET FOR RADIOTHERAPY DEVICES, BY REGION, 2022–2029 (USD MILLION)
    6.10 DENTAL EQUIPMENT 
           TABLE 89 MARKET FOR DENTAL EQUIPMENT, BY TYPE,  2022–2029 (USD MILLION)
           TABLE 90 MARKET FOR DENTAL EQUIPMENT,  BY SERVICE PROVIDER, 2022–2029 (USD MILLION)
           TABLE 91 MARKET FOR DENTAL EQUIPMENT,  BY SERVICE TYPE, 2022–2029 (USD MILLION)
           TABLE 92 MARKET FOR DENTAL EQUIPMENT, BY END USER, 2022–2029 (USD MILLION)
           TABLE 93 MARKET FOR DENTAL EQUIPMENT,  BY CONTRACT TYPE, 2022–2029 (USD MILLION)
           TABLE 94 MARKET FOR DENTAL EQUIPMENT, BY REGION, 2022–2029 (USD MILLION)
           6.10.1 DENTAL RADIOLOGY EQUIPMENT
                    6.10.1.1 Reduced technological complexity and ease of utilization to drive segment
                                 TABLE 95 MARKET FOR DENTAL RADIOLOGY EQUIPMENT,  BY REGION, 2022–2029 (USD MILLION)
           6.10.2 DENTAL LASER DEVICES
                    6.10.2.1 Periodic maintenance of dental laser devices to increase power output
                                 TABLE 96 MARKET FOR DENTAL LASER DEVICES, BY REGION, 2022–2029 (USD MILLION)
           6.10.3 OTHER DENTAL EQUIPMENT
                    TABLE 97 MARKET FOR OTHER DENTAL EQUIPMENT, BY REGION, 2022–2029 (USD MILLION)
    6.11 LABORATORY EQUIPMENT 
           6.11.1 INCREASED GOVERNMENT INITIATIVES AND LARGE NUMBER OF CLINICAL AUTOMATION SYSTEMS TO DRIVE MARKET
                     TABLE 98 MARKET FOR LABORATORY EQUIPMENT,  BY SERVICE PROVIDER, 2022–2029 (USD MILLION)
                     TABLE 99 MARKET FOR LABORATORY EQUIPMENT,  BY SERVICE TYPE, 2022–2029 (USD MILLION)
                     TABLE 100 MARKET FOR LABORATORY EQUIPMENT,  BY END USER, 2022–2029 (USD MILLION)
                     TABLE 101 MARKET FOR LABORATORY EQUIPMENT,  BY CONTRACT TYPE, 2022–2029 (USD MILLION)
                     TABLE 102 MARKET FOR LABORATORY EQUIPMENT,  BY REGION, 2022–2029 (USD MILLION)
    6.12 DURABLE MEDICAL EQUIPMENT 
           6.12.1 GROWING AWARENESS ABOUT IN-HOUSE MAINTENANCE SERVICES TO DRIVE MARKET
                     TABLE 103 MARKET FOR DURABLE MEDICAL EQUIPMENT,  BY SERVICE PROVIDER, 2022–2029 (USD MILLION)
                     TABLE 104 MARKET FOR DURABLE MEDICAL EQUIPMENT,  BY SERVICE TYPE, 2022–2029 (USD MILLION)
                     TABLE 105 MARKET FOR DURABLE MEDICAL EQUIPMENT,  BY END USER, 2022–2029 (USD MILLION)
                     TABLE 106 MARKET FOR DURABLE MEDICAL EQUIPMENT,  BY CONTRACT TYPE, 2022–2029 (USD MILLION)
                     TABLE 107 MARKET FOR DURABLE MEDICAL EQUIPMENT,  BY REGION, 2022–2029 (USD MILLION)
 
7 MEDICAL EQUIPMENT MAINTENANCE MARKET, BY SERVICE TYPE (Page No. - 159)
    7.1 INTRODUCTION 
          TABLE 108 MEDICAL EQUIPMENT MAINTENANCE INDUSTRY, BY SERVICE TYPE,  2022–2029 (USD MILLION)
    7.2 PREVENTIVE MAINTENANCE 
           7.2.1 INCREASED DEVICE LIFESPAN AND REDUCED SERVICE COSTS FOR HOSPITALS TO DRIVE MARKET GROWTH
                    TABLE 109 MARKET FOR PREVENTIVE MAINTENANCE,  BY REGION, 2022–2029 (USD MILLION)
    7.3 CORRECTIVE MAINTENANCE 
           7.3.1 HIGH AVAILABILITY OF COST-EFFECTIVE MULTI-VENDOR MEDICAL DEVICE SPARE PARTS TO BOOST MARKET
                    TABLE 110 MARKET FOR CORRECTIVE MAINTENANCE,  BY REGION, 2022–2029 (USD MILLION)
    7.4 OPERATIONAL MAINTENANCE 
           7.4.1 REDUCED EQUIPMENT DOWNTIME AND DECREASED MAINTENANCE COSTS TO DRIVE MARKET
                    TABLE 111 MARKET FOR OPERATIONAL MAINTENANCE,  BY REGION, 2022–2029 (USD MILLION)
 
8 MEDICAL EQUIPMENT MAINTENANCE MARKET,  BY SERVICE PROVIDER (Page No. - 164)
    8.1 INTRODUCTION 
          TABLE 112 COST OF CONTRACTS FROM DIFFERENT TYPES OF SERVICE PROVIDERS
          TABLE 113 MEDICAL EQUIPMENT MAINTENANCE INDUSTRY, BY SERVICE PROVIDER,  2022–2029 (USD MILLION)
    8.2 MULTI-VENDOR OEMS 
           8.2.1 AVAILABILITY OF 24/7 TECHNICAL ASSISTANCE BY MULTI-VENDOR OEMS TO DRIVE MARKET
                    TABLE 114 MARKET FOR MULTI-VENDOR OEMS, BY REGION, 2022–2029 (USD MILLION)
    8.3 SINGLE-VENDOR OEMS 
           8.3.1 INCREASED COMPLEXITY IN SINGLE-VENDOR MAINTENANCE SERVICES AND CONTRACTS TO LIMIT MARKET GROWTH
                    TABLE 115 MARKET FOR SINGLE-VENDOR OEMS, BY REGION, 2022–2029 (USD MILLION)
    8.4 INDEPENDENT SERVICE ORGANIZATIONS 
           8.4.1 LOWER COST OF CONTRACTS AND REDUCED OPERATING EXPENSES TO BOOST MARKET
                    TABLE 116 MARKET FOR INDEPENDENT SERVICE ORGANIZATIONS, BY REGION, 2022–2029 (USD MILLION)
    8.5 IN-HOUSE MAINTENANCE 
           8.5.1 QUICK RESPONSE TIME FOR MEDICAL SYSTEM BREAKDOWNS TO FUEL GROWTH
                    TABLE 117 MARKET FOR IN-HOUSE MAINTENANCE,  BY COUNTRY, 2022–2029 (USD MILLION)
 
9 MEDICAL EQUIPMENT MAINTENANCE MARKET, BY CONTRACT TYPE (Page No. - 171)
    9.1 INTRODUCTION 
          TABLE 118 MEDICAL EQUIPMENT MAINTENANCE INDUSTRY, BY CONTRACT TYPE,  2022–2029 (USD MILLION)
    9.2 PREMIUM CONTRACTS 
           9.2.1 BETTER RETURNS ON INVESTMENT AND REDUCED COMPLEXITY TO DRIVE MARKET GROWTH
                    TABLE 119 MARKET FOR PREMIUM CONTRACTS, BY REGION,  2022–2029 (USD MILLION)
    9.3 BASIC CONTRACTS 
           9.3.1 AFFORDABLE PRICING OF BASIC MEDICAL DEVICE MAINTENANCE CONTRACTS TO FAVOR MARKET GROWTH
                    TABLE 120 MARKET FOR BASIC CONTRACTS, BY REGION,  2022–2029 (USD MILLION)
    9.4 CUSTOMIZED CONTRACTS 
           9.4.1 INCREASED POPULARITY OF TAILOR-MADE MAINTENANCE SERVICES FOR MEDICAL DEVICES TO DRIVE GROWTH
                    TABLE 121 MARKET FOR CUSTOMIZED CONTRACTS,  BY REGION, 2022–2029 (USD MILLION)
    9.5 ADD-ON CONTRACTS 
           9.5.1 EASY INTRODUCTION OF NEW SERVICES FOR CLIENTS TO PROPEL GROWTH
                    TABLE 122 MARKET FOR ADD-ON CONTRACTS, BY REGION,  2022–2029 (USD MILLION)
 
10 MEDICAL EQUIPMENT MAINTENANCE MARKET, BY END USER (Page No. - 176)
     10.1 INTRODUCTION 
             TABLE 123 MEDICAL EQUIPMENT MAINTENANCE INDUSTRY, BY END USER,  2022–2029 (USD MILLION)
     10.2 HOSPITALS 
             10.2.1 INCREASING NUMBER OF SURGERIES AND DIAGNOSTIC IMAGING PROCEDURES TO DRIVE MARKET GROWTH
                        TABLE 124 MARKET FOR HOSPITALS, BY REGION,  2022–2029 (USD MILLION)
     10.3 AMBULATORY SURGICAL CENTERS 
             10.3.1 LESS TIME-CONSUMING TREATMENTS AND COST-EFFECTIVE DIAGNOSIS TO BOOST GROWTH
                        TABLE 125 MARKET FOR AMBULATORY SURGICAL CENTERS, BY REGION, 2022–2029 (USD MILLION)
     10.4 DENTAL CLINICS & SPECIALTY CLINICS 
             10.4.1 LOWER COST REQUIREMENTS AND HIGHER PATIENT PREFERENCE FOR OUTPATIENT CARE TO FAVOR MARKET GROWTH
                        TABLE 126 MARKET FOR DENTAL CLINICS & SPECIALTY CLINICS, BY REGION, 2022–2029 (USD MILLION)
     10.5 DIAGNOSTIC IMAGING CENTERS 
             10.5.1 INCREASING NUMBER OF PRIVATE IMAGING CENTERS TO FUEL GROWTH
                        TABLE 127 MARKET FOR DIAGNOSTIC IMAGING CENTERS,  BY REGION, 2022–2029 (USD MILLION)
     10.6 DIALYSIS CENTERS 
             10.6.1 INCREASING NUMBER OF PRIVATE AND PUBLIC DIALYSIS CENTERS IN EMERGING ECONOMIES TO BOOST MARKET
                        TABLE 128 MARKET FOR DIALYSIS CENTERS,  BY REGION, 2022–2029 (USD MILLION)
     10.7 OTHER END USERS 
             TABLE 129 MARKET FOR OTHER END USERS, BY REGION, 2022–2029 (USD MILLION)
 
11 MEDICAL EQUIPMENT MAINTENANCE MARKET, BY REGION (Page No. - 184)
     11.1 INTRODUCTION 
             TABLE 130 MEDICAL EQUIPMENT MAINTENANCE INDUSTRY, BY REGION, 2022–2029 (USD MILLION)
     11.2 NORTH AMERICA 
             FIGURE 36 NORTH AMERICA: MEDICAL EQUIPMENT MAINTENANCE MARKET SNAPSHOT
             TABLE 131 NORTH AMERICA: MARKET, BY COUNTRY,  2022–2029 (USD MILLION)
             TABLE 132 NORTH AMERICA: MARKET, BY DEVICE TYPE,  2022–2029 (USD MILLION)
             TABLE 133 NORTH AMERICA: MEDIAL EQUIPMENT MAINTENANCE MARKET FOR DIAGNOSTIC IMAGING EQUIPMENT, BY TYPE, 2022–2029 (USD MILLION)
             TABLE 134 NORTH AMERICA: MARKET FOR PATIENT MONITORING & LIFE SUPPORT DEVICES, BY TYPE, 2022–2029 (USD MILLION)
             TABLE 135 NORTH AMERICA: MARKET FOR DENTAL EQUIPMENT, BY TYPE, 2022–2029 (USD MILLION)
             TABLE 136 NORTH AMERICA: MARKET, BY SERVICE PROVIDER, 2022–2029 (USD MILLION)
             TABLE 137 NORTH AMERICA: MARKET, BY SERVICE TYPE,  2022–2029 (USD MILLION)
             TABLE 138 NORTH AMERICA: MARKET, BY CONTRACT TYPE,  2022–2029 (USD MILLION)
             TABLE 139 NORTH AMERICA: MARKET, BY END USER,  2022–2029 (USD MILLION)
             11.2.1 NORTH AMERICA: RECESSION IMPACT
             11.2.2 US
                        11.2.2.1 Rising geriatric population and increasing incidence of lifestyle diseases to drive market
                                      TABLE 140 US: MEDICAL EQUIPMENT MAINTENANCE MARKET, BY DEVICE TYPE,  2022–2029 (USD MILLION)
                                      TABLE 141 US: MARKET FOR DIAGNOSTIC IMAGING EQUIPMENT, BY TYPE, 2022–2029 (USD MILLION)
                                      TABLE 142 US: MARKET FOR PATIENT MONITORING & LIFE SUPPORT DEVICES, BY TYPE, 2022–2029 (USD MILLION)
                                      TABLE 143 US: MARKET FOR DENTAL EQUIPMENT, BY TYPE, 2022–2029 (USD MILLION)
             11.2.3 CANADA
                        11.2.3.1 Increasing adoption of refurbished medical equipment to boost market
                                      TABLE 144 CANADA: MEDICAL EQUIPMENT MAINTENANCE MARKET, BY DEVICE TYPE,  2022–2029 (USD MILLION)
                                      TABLE 145 CANADA: MARKET FOR DIAGNOSTIC IMAGING EQUIPMENT, BY TYPE, 2022–2029 (USD MILLION)
                                      TABLE 146 CANADA: MARKET FOR PATIENT MONITORING & LIFE SUPPORT DEVICES, BY TYPE, 2022–2029 (USD MILLION)
                                      TABLE 147 CANADA: MARKET FOR DENTAL EQUIPMENT,  BY TYPE, 2022–2029 (USD MILLION)
     11.3 EUROPE 
             TABLE 148 EUROPE: MEDICAL EQUIPMENT MAINTENANCE MARKET, BY COUNTRY,  2022–2029 (USD MILLION)
             TABLE 149 EUROPE: MARKET, BY DEVICE TYPE,  2022–2029 (USD MILLION)
             TABLE 150 EUROPE: MEDIAL EQUIPMENT MAINTENANCE MARKET FOR DIAGNOSTIC IMAGING EQUIPMENT, BY TYPE, 2022–2029 (USD MILLION)
             TABLE 151 EUROPE: MARKET FOR PATIENT MONITORING & LIFE SUPPORT DEVICES, BY TYPE, 2022–2029 (USD MILLION)
             TABLE 152 EUROPE: MARKET FOR DENTAL EQUIPMENT,  BY TYPE, 2022–2029 (USD MILLION)
             TABLE 153 EUROPE: MARKET, BY SERVICE PROVIDER,  2022–2029 (USD MILLION)
             TABLE 154 EUROPE: MARKET, BY SERVICE TYPE,  2022–2029 (USD MILLION)
             TABLE 155 EUROPE: MARKET, BY CONTRACT TYPE,  2022–2029 (USD MILLION)
             TABLE 156 EUROPE: MARKET, BY END USER,  2022–2029 (USD MILLION)
             11.3.1 EUROPE: RECESSION IMPACT
             11.3.2 GERMANY
                        11.3.2.1 Germany to command largest market share in European medical equipment maintenance during forecast period
                                      TABLE 157 GERMANY: MEDICAL EQUIPMENT MAINTENANCE MARKET, BY DEVICE TYPE,  2022–2029 (USD MILLION)
                                      TABLE 158 GERMANY: MARKET FOR DIAGNOSTIC IMAGING EQUIPMENT, BY TYPE, 2022–2029 (USD MILLION)
                                      TABLE 159 GERMANY: MARKET FOR PATIENT MONITORING & LIFE SUPPORT DEVICES, BY TYPE, 2022–2029 (USD MILLION)
                                      TABLE 160 GERMANY: MARKET FOR DENTAL EQUIPMENT,  BY TYPE, 2022–2029 (USD MILLION)
             11.3.3 UK
                        11.3.3.1 Increasing public-private partnerships for healthcare facilities and growing government initiatives to drive market
                                      TABLE 161 UK: MEDICAL EQUIPMENT MAINTENANCE MARKET, BY DEVICE TYPE,  2022–2029 (USD MILLION)
                                      TABLE 162 UK: MARKET FOR DIAGNOSTIC IMAGING EQUIPMENT, BY TYPE, 2022–2029 (USD MILLION)
                                      TABLE 163 UK: MARKET FOR PATIENT MONITORING & LIFE SUPPORT DEVICES, BY TYPE, 2022–2029 (USD MILLION)
                                      TABLE 164 UK: MARKET FOR DENTAL EQUIPMENT, BY TYPE, 2022–2029 (USD MILLION)
             11.3.4 FRANCE
                        11.3.4.1 Rising demand for cost-effective in-house maintenance and increasing influx of multinational companies to drive market
                                      TABLE 165 FRANCE: MEDICAL EQUIPMENT MAINTENANCE MARKET, BY DEVICE TYPE,  2022–2029 (USD MILLION)
                                      TABLE 166 FRANCE: MARKET FOR DIAGNOSTIC IMAGING EQUIPMENT, BY TYPE, 2022–2029 (USD MILLION)
                                      TABLE 167 FRANCE: MARKET FOR PATIENT MONITORING & LIFE SUPPORT DEVICES, BY TYPE, 2022–2029 (USD MILLION)
                                      TABLE 168 FRANCE: MARKET FOR DENTAL EQUIPMENT,  BY TYPE, 2022–2029 (USD MILLION)
             11.3.5 ITALY
                        11.3.5.1 High focus on value-based healthcare systems to drive market growth
                                      TABLE 169 ITALY: MEDICAL EQUIPMENT MAINTENANCE MARKET, BY DEVICE TYPE,  2022–2029 (USD MILLION)
                                      TABLE 170 ITALY: MARKET FOR DIAGNOSTIC IMAGING EQUIPMENT, BY TYPE, 2022–2029 (USD MILLION)
                                      TABLE 171 ITALY: MARKET FOR PATIENT MONITORING & LIFE SUPPORT DEVICES, BY TYPE, 2022–2029 (USD MILLION)
                                      TABLE 172 ITALY: MARKET FOR DENTAL EQUIPMENT, BY TYPE, 2022–2029 (USD MILLION)
             11.3.6 SPAIN
                        11.3.6.1 Growing investments in advanced technologies and budget constraints for new devices to propel market
                                      TABLE 173 SPAIN: MEDICAL EQUIPMENT MAINTENANCE MARKET, BY DEVICE TYPE,  2022–2029 (USD MILLION)
                                      TABLE 174 SPAIN: MARKET FOR DIAGNOSTIC IMAGING EQUIPMENT, BY TYPE, 2022–2029 (USD MILLION)
                                      TABLE 175 SPAIN: MARKET FOR PATIENT MONITORING & LIFE SUPPORT DEVICES, BY TYPE, 2022–2029 (USD MILLION)
                                      TABLE 176 SPAIN: MARKET FOR DENTAL EQUIPMENT, BY TYPE, 2022–2029 (USD MILLION)
             11.3.7 REST OF EUROPE
                        TABLE 177 REST OF EUROPE: MEDICAL EQUIPMENT MAINTENANCE MARKET, BY DEVICE TYPE,  2022–2029 (USD MILLION)
                        TABLE 178 REST OF EUROPE: MARKET FOR DIAGNOSTIC IMAGING EQUIPMENT, BY TYPE, 2022–2029 (USD MILLION)
                        TABLE 179 REST OF EUROPE: MARKET FOR PATIENT MONITORING & LIFE SUPPORT DEVICES, BY TYPE, 2022–2029 (USD MILLION)
                        TABLE 180 REST OF EUROPE: MARKET FOR DENTAL EQUIPMENT, BY TYPE, 2022–2029 (USD MILLION)
     11.4 ASIA PACIFIC 
             FIGURE 37 ASIA PACIFIC: MEDICAL EQUIPMENT MAINTENANCE MARKET SNAPSHOT
             TABLE 181 ASIA PACIFIC: MARKET, BY COUNTRY,  2022–2029 (USD MILLION)
             TABLE 182 ASIA PACIFIC: MARKET, BY DEVICE TYPE,  2022–2029 (USD MILLION)
             TABLE 183 ASIA PACIFIC: MARKET FOR DIAGNOSTIC IMAGING EQUIPMENT, BY TYPE, 2022–2029 (USD MILLION)
             TABLE 184 ASIA PACIFIC: MARKET FOR PATIENT MONITORING & LIFE SUPPORT DEVICES, BY TYPE, 2022–2029 (USD MILLION)
             TABLE 185 ASIA PACIFIC: MARKET FOR DENTAL EQUIPMENT, BY TYPE, 2022–2029 (USD MILLION)
             TABLE 186 ASIA PACIFIC: MARKET, BY SERVICE PROVIDER,  2022–2029 (USD MILLION)
             TABLE 187 ASIA PACIFIC: MARKET, BY SERVICE TYPE,  2022–2029 (USD MILLION)
             TABLE 188 ASIA PACIFIC: MARKET, BY CONTRACT TYPE,  2022–2029 (USD MILLION)
             TABLE 189 ASIA PACIFIC: MARKET, BY END USER,  2022–2029 (USD MILLION)
             11.4.1 ASIA PACIFIC: RECESSION IMPACT
             11.4.2 JAPAN
                        11.4.2.1 Rising healthcare costs and increasing geriatric population to drive market growth
                                      TABLE 190 JAPAN: MEDICAL EQUIPMENT MAINTENANCE MARKET, BY DEVICE TYPE,  2022–2029 (USD MILLION)
                                      TABLE 191 JAPAN: MARKET FOR DIAGNOSTIC IMAGING EQUIPMENT, BY TYPE, 2022–2029 (USD MILLION)
                                      TABLE 192 JAPAN: MARKET FOR PATIENT MONITORING & LIFE SUPPORT DEVICES, BY TYPE, 2022–2029 (USD MILLION)
                                      TABLE 193 JAPAN: MARKET FOR DENTAL EQUIPMENT, BY TYPE, 2022–2029 (USD MILLION)
             11.4.3 CHINA
                        11.4.3.1 Growing demand for advanced and premium-priced medical equipment to favor market growth
                                      TABLE 194 CHINA: MEDICAL EQUIPMENT MAINTENANCE MARKET, BY DEVICE TYPE,  2022–2029 (USD MILLION)
                                      TABLE 195 CHINA: MARKET FOR DIAGNOSTIC IMAGING EQUIPMENT, BY TYPE, 2022–2029 (USD MILLION)
                                      TABLE 196 CHINA: MARKET FOR PATIENT MONITORING & LIFE SUPPORT DEVICES, BY TYPE, 2022–2029 (USD MILLION)
                                      TABLE 197 CHINA: MARKET FOR DENTAL EQUIPMENT, BY TYPE, 2022–2029 (USD MILLION)
             11.4.4 INDIA
                        11.4.4.1 Growing FDI influx in healthcare and increasing medical tourism to propel market growth
                                      TABLE 198 INDIA: MEDICAL EQUIPMENT MAINTENANCE MARKET, BY DEVICE TYPE,  2022–2029 (USD MILLION)
                                      TABLE 199 INDIA: MARKET FOR DIAGNOSTIC IMAGING EQUIPMENT, BY TYPE, 2022–2029 (USD MILLION)
                                      TABLE 200 INDIA: MARKET FOR PATIENT MONITORING & LIFE SUPPORT DEVICES, BY TYPE, 2022–2029 (USD MILLION)
                                      TABLE 201 INDIA: MARKET FOR DENTAL EQUIPMENT, BY TYPE, 2022–2029 (USD MILLION)
             11.4.5 AUSTRALIA
                        11.4.5.1 Favorable healthcare system and preference for new medical equipment to limit market
                                      TABLE 202 AUSTRALIA: MEDICAL EQUIPMENT MAINTENANCE MARKET, BY DEVICE TYPE,  2022–2029 (USD MILLION)
                                      TABLE 203 AUSTRALIA: MARKET FOR DIAGNOSTIC IMAGING EQUIPMENT, BY TYPE, 2022–2029 (USD MILLION)
                                      TABLE 204 AUSTRALIA: MARKET FOR PATIENT MONITORING & LIFE SUPPORT DEVICES, BY TYPE, 2022–2029 (USD MILLION)
                                      TABLE 205 AUSTRALIA: MARKET FOR DENTAL EQUIPMENT,  BY TYPE, 2022–2029 (USD MILLION)
             11.4.6 SOUTH KOREA
                        11.4.6.1 Large number of private hospitals and increased preference for refurbished medical equipment to fuel growth
                                      TABLE 206 SOUTH KOREA: MEDICAL EQUIPMENT MAINTENANCE MARKET, BY DEVICE TYPE,  2022–2029 (USD MILLION)
                                      TABLE 207 SOUTH KOREA: MARKET FOR DIAGNOSTIC IMAGING EQUIPMENT, BY TYPE, 2022–2029 (USD MILLION)
                                      TABLE 208 SOUTH KOREA: MARKET FOR PATIENT MONITORING & LIFE SUPPORT DEVICES, BY TYPE, 2022–2029 (USD MILLION)
                                      TABLE 209 SOUTH KOREA: MARKET FOR DENTAL EQUIPMENT, BY TYPE, 2022–2029 (USD MILLION)
             11.4.7 REST OF ASIA PACIFIC
                        TABLE 210 REST OF ASIA PACIFIC: MEDICAL EQUIPMENT MAINTENANCE MARKET, BY DEVICE TYPE, 2022–2029 (USD MILLION)
                        TABLE 211 REST OF ASIA PACIFIC: MARKET FOR DIAGNOSTIC IMAGING EQUIPMENT, BY TYPE, 2022–2029 (USD MILLION)
                        TABLE 212 REST OF ASIA PACIFIC: MARKET FOR PATIENT MONITORING & LIFE SUPPORT DEVICES, BY TYPE, 2022–2029 (USD MILLION)
                        TABLE 213 REST OF ASIA PACIFIC: MARKET FOR DENTAL EQUIPMENT, BY TYPE, 2022–2029 (USD MILLION)
     11.5 LATIN AMERICA 
             TABLE 214 LATIN AMERICA: MEDICAL EQUIPMENT MAINTENANCE MARKET, BY COUNTRY,  2022–2029 (USD MILLION)
             TABLE 215 LATIN AMERICA: MARKET, BY DEVICE TYPE,  2022–2029 (USD MILLION)
             TABLE 216 LATIN AMERICA: MARKET FOR DIAGNOSTIC IMAGING EQUIPMENT, BY TYPE, 2022–2029 (USD MILLION)
             TABLE 217 LATIN AMERICA: MARKET FOR PATIENT MONITORING & LIFE SUPPORT DEVICES, BY TYPE, 2022–2029 (USD MILLION)
             TABLE 218 LATIN AMERICA: MARKET FOR DENTAL EQUIPMENT, BY TYPE, 2022–2029 (USD MILLION)
             TABLE 219 LATIN AMERICA: MARKET, BY SERVICE PROVIDER, 2022–2029 (USD MILLION)
             TABLE 220 LATIN AMERICA: MARKET, BY SERVICE TYPE,  2022–2029 (USD MILLION)
             TABLE 221 LATIN AMERICA: MARKET, BY CONTRACT TYPE,  2022–2029 (USD MILLION)
             TABLE 222 LATIN AMERICA: MARKET, BY END USER,  2022–2029 (USD MILLION)
             11.5.1 LATIN AMERICA: RECESSION IMPACT
             11.5.2 BRAZIL
                        11.5.2.1 Rising awareness about advanced diagnostic and treatment procedures to drive market
                                      TABLE 223 BRAZIL: MEDICAL EQUIPMENT MAINTENANCE MARKET, BY DEVICE TYPE,  2022–2029 (USD MILLION)
                                      TABLE 224 BRAZIL: MARKET FOR DIAGNOSTIC IMAGING EQUIPMENT, BY TYPE, 2022–2029 (USD MILLION)
                                      TABLE 225 BRAZIL: MARKET FOR PATIENT MONITORING & LIFE SUPPORT DEVICES, BY TYPE, 2022–2029 (USD MILLION)
                                      TABLE 226 BRAZIL: MARKET FOR DENTAL EQUIPMENT,  BY TYPE, 2022–2029 (USD MILLION)
             11.5.3 MEXICO
                        11.5.3.1 Favorable investment scenario for medical device manufacturers to propel market growth
                                      TABLE 227 MEXICO: MEDICAL EQUIPMENT MAINTENANCE MARKET, BY DEVICE TYPE,  2022–2029 (USD MILLION)
                                      TABLE 228 MEXICO: MARKET FOR DIAGNOSTIC IMAGING EQUIPMENT, BY TYPE, 2022–2029 (USD MILLION)
                                      TABLE 229 MEXICO: MARKET FOR PATIENT MONITORING & LIFE SUPPORT DEVICES, BY TYPE, 2022–2029 (USD MILLION)
                                      TABLE 230 MEXICO: MARKET FOR DENTAL EQUIPMENT,  BY TYPE, 2022–2029 (USD MILLION)
             11.5.4 REST OF LATIN AMERICA
                        TABLE 231 REST OF LATIN AMERICA: MEDICAL EQUIPMENT MAINTENANCE MARKET, BY DEVICE TYPE, 2022–2029 (USD MILLION)
                        TABLE 232 REST OF LATIN AMERICA: MARKET FOR DIAGNOSTIC IMAGING EQUIPMENT, BY TYPE, 2022–2029 (USD MILLION)
                        TABLE 233 REST OF LATIN AMERICA: MARKET FOR PATIENT MONITORING & LIFE SUPPORT DEVICES, BY TYPE, 2022–2029 (USD MILLION)
                        TABLE 234 REST OF LATIN AMERICA: MARKET FOR DENTAL EQUIPMENT, BY TYPE, 2022–2029 (USD MILLION)
     11.6 MIDDLE EAST & AFRICA 
             11.6.1 MIDDLE EAST & AFRICA: RECESSION IMPACT
                        TABLE 235 MIDDLE EAST & AFRICA: MEDICAL EQUIPMENT MAINTENANCE MARKET, BY COUNTRY, 2022–2029 (USD MILLION)
                        TABLE 236 MIDDLE EAST & AFRICA: MARKET, BY DEVICE TYPE, 2022–2029 (USD MILLION)
                        TABLE 237 MIDDLE EAST & AFRICA: MARKET FOR DIAGNOSTIC IMAGING EQUIPMENT, BY TYPE, 2022–2029 (USD MILLION)
                        TABLE 238 MIDDLE EAST & AFRICA: MARKET FOR PATIENT MONITORING & LIFE SUPPORT DEVICES, BY TYPE, 2022–2029 (USD MILLION)
                        TABLE 239 MIDDLE EAST & AFRICA: MARKET FOR DENTAL EQUIPMENT, BY TYPE, 2022–2029 (USD MILLION)
                        TABLE 240 MIDDLE EAST & AFRICA: MARKET,  BY SERVICE PROVIDER, 2022–2029 (USD MILLION)
                        TABLE 241 MIDDLE EAST & AFRICA: MARKET,  BY SERVICE TYPE, 2022–2029 (USD MILLION)
                        TABLE 242 MIDDLE EAST & AFRICA: MARKET,  BY CONTRACT TYPE, 2022–2029 (USD MILLION)
                        TABLE 243 MIDDLE EAST & AFRICA: MARKET, BY END USER, 2022–2029 (USD MILLION)
             11.6.2 GCC COUNTRIES
                        11.6.2.1 Higher disposable incomes to foster market growth
                                      TABLE 244 GCC COUNTRIES: MEDICAL EQUIPMENT MAINTENANCE MARKET, BY DEVICE TYPE,  2022–2029 (USD MILLION)
                                      TABLE 245 GCC COUNTRIES: MARKET FOR DIAGNOSTIC IMAGING EQUIPMENT, BY TYPE, 2022–2029 (USD MILLION)
                                      TABLE 246 GCC COUNTRIES: MARKET FOR PATIENT MONITORING & LIFE SUPPORT DEVICES, BY TYPE, 2022–2029 (USD MILLION)
                                      TABLE 247 GCC COUNTRIES: MARKET FOR DENTAL EQUIPMENT, BY TYPE, 2022–2029 (USD MILLION)
             11.6.3 REST OF MIDDLE EAST & AFRICA
                        TABLE 248 REST OF MIDDLE EAST & AFRICA: MEDICAL EQUIPMENT MAINTENANCE MARKET,  BY DEVICE TYPE, 2022–2029 (USD MILLION)
                        TABLE 249 REST OF MIDDLE EAST & AFRICA: MARKET FOR DIAGNOSTIC IMAGING EQUIPMENT, BY TYPE, 2022–2029 (USD MILLION)
                        TABLE 250 REST OF MIDDLE EAST & AFRICA: MARKET FOR PATIENT MONITORING & LIFE SUPPORT DEVICES, BY TYPE, 2022–2029 (USD MILLION)
                        TABLE 251 REST OF MIDDLE EAST & AFRICA: MARKET FOR DENTAL EQUIPMENT, BY TYPE, 2022–2029 (USD MILLION)
 
12 COMPETITIVE LANDSCAPE (Page No. - 263)
     12.1 INTRODUCTION 
     12.2 KEY PLAYER STRATEGIES/RIGHT-TO-WIN 
             FIGURE 38 KEY DEVELOPMENTS BY MAJOR PLAYERS IN MEDICAL EQUIPMENT MAINTENANCE MARKET, 2021–2024
             12.2.1 RIGHT-TO-WIN STRATEGIES ADOPTED BY MAJOR PLAYERS IN MEDICAL EQUIPMENT MAINTENANCE INDUSTRY
     12.3 REVENUE ANALYSIS 
             FIGURE 39 REVENUE ANALYSIS OF KEY PLAYERS IN MEDICAL EQUIPMENT MAINTENANCE INDUSTRY (2021–2023)
     12.4 MARKET SHARE ANALYSIS 
             FIGURE 40 MEDICAL EQUIPMENT MAINTENANCE INDUSTRY SHARE, BY KEY PLAYER, 2023
             TABLE 252 DEGREE OF COMPETITION: MEDICAL EQUIPMENT MAINTENANCE INDUSTRY
     12.5 COMPANY EVALUATION MATRIX: KEY PLAYERS, 2023 
             12.5.1 STARS
             12.5.2 EMERGING LEADERS
             12.5.3 PERVASIVE PLAYERS
             12.5.4 PARTICIPANTS
                        FIGURE 41 MEDICAL EQUIPMENT MAINTENANCE INDUSTRY: COMPANY EVALUATION MATRIX (KEY PLAYERS), 2023
             12.5.5 COMPANY FOOTPRINT: KEY PLAYERS, 2023
                        12.5.5.1 Company Footprint
                                      TABLE 253 MEDICAL EQUIPMENT MAINTENANCE INDUSTRY: COMPANY FOOTPRINT
                        12.5.5.2 Service footprint
                                      TABLE 254 MEDICAL EQUIPMENT MAINTENANCE INDUSTRY: SERVICE FOOTPRINT
                        12.5.5.3 End-user footprint
                                      TABLE 255 MEDICAL EQUIPMENT MAINTENANCE INDUSTRY: END-USER FOOTPRINT
     12.6 COMPANY EVALUATION MATRIX: STARTUPS/SMES, 2023 
             12.6.1 PROGRESSIVE COMPANIES
             12.6.2 RESPONSIVE COMPANIES
             12.6.3 DYNAMIC COMPANIES
             12.6.4 STARTING BLOCKS
                        FIGURE 42 MEDICAL EQUIPMENT MAINTENANCE INDUSTRY: COMPANY EVALUATION MATRIX (STARTUPS/SMES), 2023
             12.6.5 COMPETITIVE BENCHMARKING: STARTUPS/SMES, 2023
                        TABLE 256 MEDICAL EQUIPMENT MAINTENANCE INDUSTRY: DETAILED LIST OF KEY  STARTUPS/SMES
                        TABLE 257 MEDICAL EQUIPMENT MAINTENANCE INDUSTRY: COMPETITIVE BENCHMARKING  OF KEY STARTUPS/SMES
     12.7 COMPANY VALUATION & FINANCIAL METRICS 
             12.7.1 COMPANY VALUATION
                        FIGURE 43 EV/EBITDA OF KEY VENDORS
             12.7.2 FINANACIAL  METRICS
                        FIGURE 44 YEAR-TO-DATE (YTD) PRICE TOTAL RETURN AND FIVE-YEAR STOCK BETA OF  KEY VENDORS
     12.8 BRAND/SERVICE COMPARISON 
             TABLE 258 MARKET: BRAND COMPARISON
             FIGURE 45 BRAND/SERVICE COMPARATIVE ANALYSIS
     12.9 COMPETITIVE SCENARIO 
             12.9.1 SERVICE LAUNCHES
                        TABLE 259 MARKET: SERVICE LAUNCHES,  JANUARY 2021–APRIL 2024
             12.9.2 DEALS
                        TABLE 260 MARKET: DEALS, JANUARY 2021–APRIL 2024
             12.9.3 EXPANSIONS
                        TABLE 261 MARKET: EXPANSIONS,  JANUARY 2021–APRIL 2024
 
13 COMPANY PROFILES (Page No. - 280)
     13.1 KEY PLAYERS 
(Business overview, Services offered, Recent developments, Deals, MnM view, Key strengths/Right to win, Strategic choices, and Weaknesses and Competitive threats)*
             13.1.1 GE HEALTHCARE
                        TABLE 262 GE HEALTHCARE COMPANY OVERVIEW
                        FIGURE 46 GE HEALTHCARE TECHNOLOGIES INC.: COMPANY SNAPSHOT (2023)
                        TABLE 263 GE HEALTHCARE TECHNOLOGIES INC.: SERVICES OFFERED
                        TABLE 264 GE HEALTHCARE TECHNOLOGIES INC.: DEALS
                        TABLE 265 GE HEALTHCARE TECHNOLOGIES INC.: EXPANSIONS
                        TABLE 266 GE HEALTHCARE TECHNOLOGIES INC.: OTHER DEVELOPMENTS
             13.1.2 SIEMENS HEALTHINEERS
                        TABLE 267 SIEMENS HEALTHINEERS: COMPANY OVERVIEW
                        FIGURE 47 SIEMENS HEALTHINEERS: COMPANY SNAPSHOT (2023)
                        TABLE 268 SIEMENS HEALTHINEERS: SERVICES OFFERED
                        TABLE 269 SIEMENS HEALTHINEERS: DEALS
                        TABLE 270 SIEMENS HEALTHINEERS: EXPANSIONS
             13.1.3 KONINKLIJKE PHILIPS N.V.
                        TABLE 271 KONINKLIJKE PHILIPS N.V.: COMPANY OVERVIEW
                        FIGURE 48 KONINKLIJKE PHILIPS N.V.: COMPANY SNAPSHOT (2023)
                        TABLE 272 KONINKLIJKE PHILIPS N.V.: SERVICES OFFERED
                        TABLE 273 KONINKLIJKE PHILIPS N.V.: DEALS
                        TABLE 274 KONINKLIJKE PHILIPS N.V.: EXPANSIONS
             13.1.4 MEDTRONIC PLC
                        TABLE 275 MEDTRONIC PLC: COMPANY OVERVIEW
                        FIGURE 49 MEDTRONIC PLC: COMPANY SNAPSHOT (2023)
                        TABLE 276 MEDTRONIC PLC: SERVICES OFFERED
                        TABLE 277 MEDTRONIC PLC: DEALS
             13.1.5 FUJIFILM HOLDINGS CORPORATION
                        TABLE 278 FUJIFILM HOLDINGS CORPORATION: COMPANY OVERVIEW
                        FIGURE 50 FUJIFILM HOLDINGS CORPORATION: COMPANY SNAPSHOT (2022)
                        TABLE 279 FUJIFILM HOLDINGS CORPORATION: SERVICES OFFERED
                        TABLE 280 FUJIFILM HOLDINGS CORPORATION: DEALS
             13.1.6 OLYMPUS CORPORATION
                        TABLE 281 OLYMPUS CORPORATION: COMPANY OVERVIEW
                        FIGURE 51 OLYMPUS CORPORATION: COMPANY SNAPSHOT (2022)
                        TABLE 282 OLYMPUS CORPORATION: SERVICES OFFERED
                        TABLE 283 OLYMPUS CORPORATION: DEALS
                        TABLE 284 OLYMPUS CORPORATION: EXPANSIONS
             13.1.7 STRYKER CORPORATION
                        TABLE 285 STRYKER CORPORATION: COMPANY OVERVIEW
                        FIGURE 52 STRYKER CORPORATION: COMPANY SNAPSHOT (2022)
                        TABLE 286 STRYKER CORPORATION: SERVICES OFFERED
                        TABLE 287 STRYKER CORPORATION: EXPANSIONS
             13.1.8 CANON INC.
                        TABLE 288 CANON INC.: COMPANY OVERVIEW
                        FIGURE 53 CANON INC.: COMPANY SNAPSHOT (2023)
                        TABLE 289 CANON INC.: SERVICES OFFERED
                        TABLE 290 CANON INC.: SERVICE LAUNCHES
                        TABLE 291 CANON INC.: DEALS
                        TABLE 292 CANON INC.: EXPANSIONS
             13.1.9 DRÄGERWERK AG & CO. KGAA
                        TABLE 293 DRÄGERWERK AG & CO. KGAA: COMPANY OVERVIEW
                        FIGURE 54 DRÄGERWERK AG & CO. KGAA: COMPANY SNAPSHOT (2023)
                        TABLE 294 DRÄGERWERK AG & CO. KGAA: SERVICES OFFERED
             13.1.10 HITACHI, LTD.
                        TABLE 295 HITACHI LTD.: COMPANY OVERVIEW
                        FIGURE 55 HITACHI, LTD.: COMPANY SNAPSHOT (2022)
                        TABLE 296 HITACHI LTD.: SERVICES OFFERED
                        TABLE 297 HITACHI LTD.: DEALS
             13.1.11 B. BRAUN SE
                        TABLE 298 B. BRAUN SE: COMPANY OVERVIEW
                        FIGURE 56 B. BRAUN SE: COMPANY SNAPSHOT (2023)
                        TABLE 299 B. BRAUN SE: SERVICES OFFERED
             13.1.12 ELEKTA
                        TABLE 300 ELEKTA: COMPANY OVERVIEW
                        FIGURE 57 ELEKTA: COMPANY SNAPSHOT (2022)
                        TABLE 301 ELEKTA: SERVICES OFFERED
                        TABLE 302 ELEKTA: SERVICE LAUNCHES
                        TABLE 303 ELEKTA: DEALS
             13.1.13 SHIMADZU CORPORATION
                        TABLE 304 SHIMADZU CORPORATION: COMPANY OVERVIEW
                        FIGURE 58 SHIMADZU CORPORATION: COMPANY SNAPSHOT (2023)
                        TABLE 305 SHIMADZU CORPORATION: SERVICES OFFERED
                        TABLE 306 SHIMADZU CORPORATION: SERVICE LAUNCHES
                        TABLE 307 SHIMADZU CORPORATION: DEALS
     13.2 OTHER PLAYERS 
             13.2.1 ALTHEA GROUP
             13.2.2 AGFA–GEVAERT GROUP
             13.2.3 BCAS BIO-MEDICAL SERVICES LTD.
             13.2.4 AGENOR
             13.2.5 GRUPO EMPRESARIAL ELECTROMÉDICO
             13.2.6 CARESTREAM HEALTH
             13.2.7 KARL STORZ GMBH & CO. KG
             13.2.8 STERIS PLC
             13.2.9 AVENSYS UK LTD.
             13.2.10 THE INTERMED GROUP
             13.2.11 CROTHALL HEALTHCARE
             13.2.12 TRIMEDX HOLDINGS LLC
 
*Details on Business overview, Services offered, Recent developments, Deals, MnM view, Key strengths/Right to win, Strategic choices, and Weaknesses and Competitive threats might not be captured in case of unlisted companies.
 
14 APPENDIX (Page No. - 332)
     14.1 DEMAND-SIDE DISCUSSION GUIDE 
     14.2 SUPPLY-SIDE DISCUSSION GUIDE 
     14.3 KNOWLEDGESTORE: MARKETSANDMARKETS’  SUBSCRIPTION PORTAL 
     14.4 CUSTOMIZATION OPTIONS 
     14.5 RELATED REPORTS 
     14.6 AUTHOR DETAILS 

This study involved the extensive use of both primary and secondary sources. The research process involved the study of various factors affecting the industry to identify the segmentation types, industry trends, key players, competitive landscape, key market dynamics, and key player strategies.

Secondary Research

The secondary research process involves the widespread use of secondary sources, directories, databases (such as Bloomberg Businessweek, Factiva, and D&B Hoovers), white papers, annual reports, company house documents, investor presentations, and SEC filings of companies. Secondary research was used to identify and collect information useful for the extensive, technical, market-oriented, and commercial study of the medical equipment maintenance market. It was also used to obtain important information about the key players and market classification & segmentation according to industry trends to the bottom-most level and key developments related to market and technology perspectives. A database of the key industry leaders was also prepared using secondary research.

Primary Research

In the primary research process, various sources from both the supply and demand sides were interviewed to obtain qualitative and quantitative information for this report. The primary sources from the supply side include industry experts such as CEOs, vice presidents, marketing and sales directors, technology & innovation directors, and related key executives from various key companies and organizations in the medical equipment maintenance market. The primary sources from the demand side include medical OEMs, medical device ISOs, and service providers, among others. Primary research was conducted to validate the market segmentation, identify key players in the market, and gather insights on key industry trends & key market dynamics.

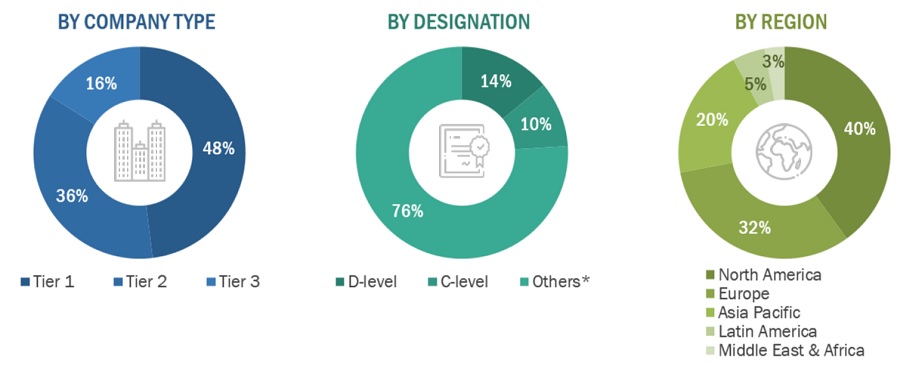
Breakdown of Primary Interviews:

A breakdown of the primary respondents for medical equipment maintenance market (supply side) market is provided below:
Medical Equipment Maintenance  Market Size, and Share

*Others include sales managers, marketing managers, business development managers, product managers, distributors, and suppliers.

Note: Companies are classified into tiers based on their total revenue. As of 2023, Tier 1 = >USD 2 billion, Tier 2 = USD 50 million to USD 2 billion, and Tier 3 = <USD 50 million.

To know about the assumptions considered for the study, download the pdf brochure

Market Estimation Methodology

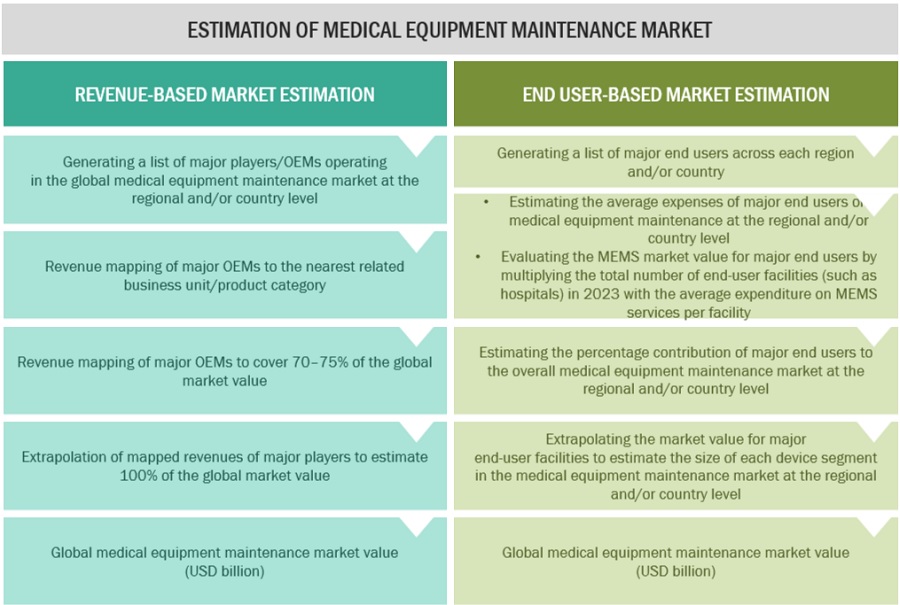
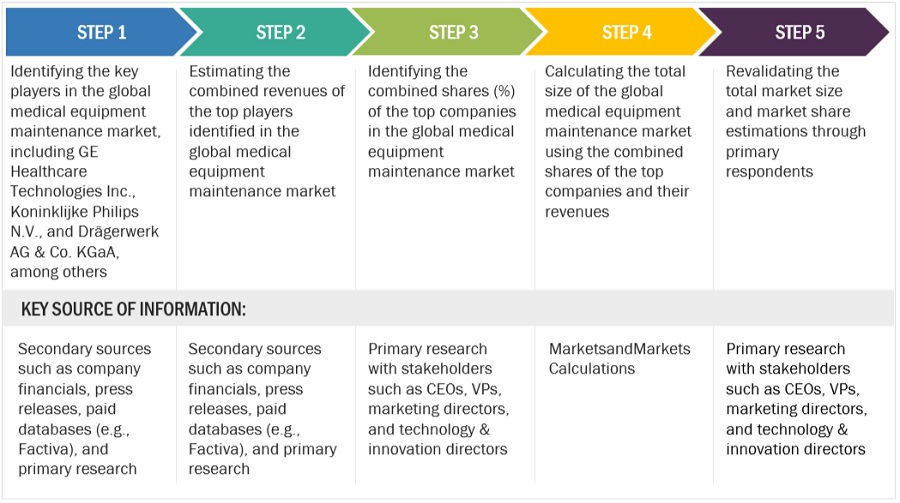
In this report, the global medical equipment maintenance market size was arrived at by using the revenue share analysis of leading players. For this purpose, key players in the market were identified, and their revenues from the medical equipment maintenance business were determined through various insights gathered during the primary and secondary research phases. Secondary research included the study of the annual and financial reports of the top market players. In contrast, primary research included extensive interviews with key opinion leaders, such as CEOs, directors, and key marketing executives.

To calculate the global market value, segmental revenues were calculated based on the revenue mapping of major solution/service providers. This process involved the following steps:

  • Generating a list of major global players operating in the medical equipment maintenance market
  • Mapping annual revenues generated by major global players from the medical equipment maintenance segment (or nearest reported business unit/service category)
  • Revenue mapping of key players to cover a major share of the global market as of 2023
  • Extrapolating the global value of the medical equipment maintenance industry
Medical Equipment Maintenance  Market Size, and Share

To know about the assumptions considered for the study, Request for Free Sample Report

Supply-Side Analysis - Revenue Share Analysis
Medical Equipment Maintenance  Market Size, and Share

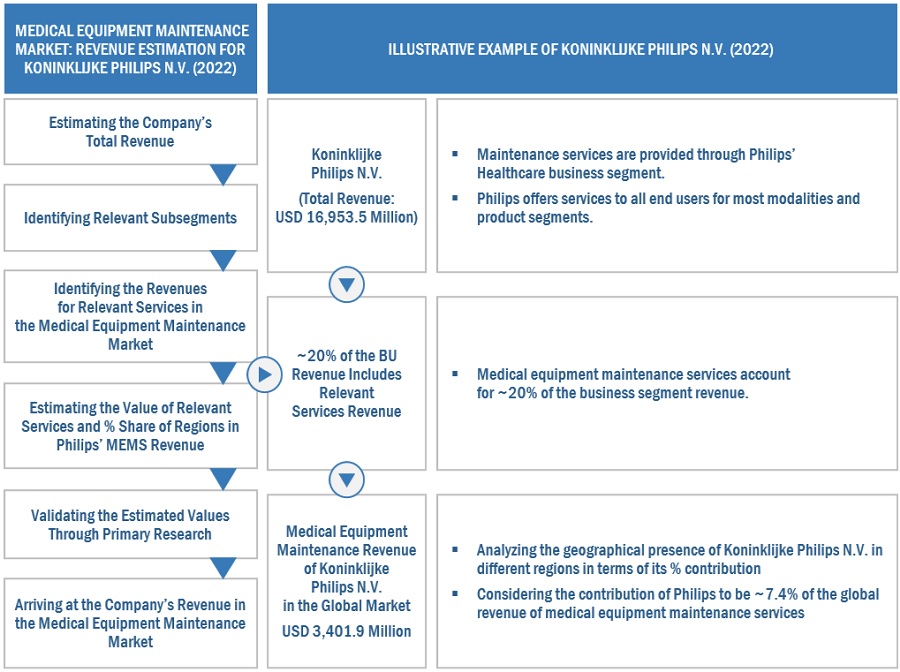
Revenue Share Analysis Illustration of Koninklijke Philips N.V.
Medical Equipment Maintenance  Market Size, and Share

Data Triangulation

After arriving at the overall market size from the market size estimation process explained above, the global medical equipment maintenance market was split into segments and subsegments. Data triangulation and market breakdown procedures were employed to complete the overall market engineering process and arrive at the exact statistics for all segments and subsegments. The data was triangulated by studying various factors and trends from both the demand and supply sides. Additionally, the medical equipment maintenance market was validated using both top-down and bottom-up approaches.

Market Definition

Medical equipment maintenance encompasses a comprehensive suite of services including monitoring, diagnosing failures, supplying spare parts, corrective maintenance, preventive maintenance, automation and upgrades, inventory management and testing, consulting, planning equipment renewal, and user training. It is indispensable for identifying and preempting potential performance issues before they escalate, thus optimizing equipment performance and curtailing operational costs. These critical services are typically executed internally or outsourced to Original Equipment Manufacturers (OEMs) or Independent Service Organizations (ISOs), ensuring the sustained reliability and efficiency of healthcare equipment.

Key Market Stakeholders

  • Original equipment manufacturers
  • Independent service providers
  • Independent service organizations
  • Product distributors and channel partners
  • Hospitals and surgical centers
  • Dental hospitals, laboratories, and clinics
  • Dental academic and research institutes
  • Ambulatory care centers and physician-operated laboratories
  • Contract manufacturers and third-party suppliers
  • Research laboratories and academic institutes
  • Clinical research organizations
  • Contract manufacturing organizations
  • Government and non-governmental regulatory authorities
  • Venture capitalists and investors
  • Trade associations and industry bodies
  • Insurance companies
  • Market research and consulting firms

Objectives of the Study

  • To define, describe, and forecast the medical equipment maintenance market on the basis of device type, service type, service provider, end user, contract type, and region.
  • To provide detailed information regarding the major factors influencing the growth potential of the global medical equipment maintenance market (drivers, restraints, opportunities, challenges, and trends).
  • To analyze the micro markets with respect to individual growth trends, future prospects, and contributions to the global medical equipment maintenance market.
  • To analyze key growth opportunities in the global medical equipment maintenance market for key stakeholders and provide details of the competitive landscape for market leaders.
  • To forecast the size of the global medical equipment maintenance market in North America, Europe, the Asia Pacific, Latin America, and the Middle East & Africa.
  • To profile the key players in the global medical equipment maintenance market and comprehensively analyze their market shares and core competencies.
  • To track and analyze the competitive developments undertaken in the global medical equipment maintenance market, such as agreements, expansions, and & acquisitions.

Available Customizations:

With the given market data, MarketsandMarkets offers customizations as per the company’s specific needs. The following customization options are available for the present global medical equipment maintenance market report:

Service Analysis

  • Service matrix, which gives a detailed comparison of the service portfolios of the top twelve companies

Company Information

  • Detailed analysis and profiling of additional market players (up to 13)

Geographic Analysis

  • Further breakdown of the Rest of Europe's medical equipment maintenance market into Russia, Belgium, the Netherlands, Switzerland, Austria, Finland, Sweden, Poland, and Portugal among other
  • Further breakdown of the Rest of Asia Pacific medical equipment maintenance market into Singapore, Taiwan, New Zealand, Philippines, Malaysia, and other APAC countries
  • Further breakdown of the Rest of the Latin America medical equipment maintenance market into Argentina, Chile, Peru, and Colombia, among other
Custom Market Research Services

We will customize the research for you, in case the report listed above does not meet with your exact requirements. Our custom research will comprehensively cover the business information you require to help you arrive at strategic and profitable business decisions.

Request Customization

Instant Answers with GPT - Ask Now!

Ask real questions. Get complete answers !
Report Code
MD 4027
Published ON
Jun, 2024
Choose License Type
BUY NOW
  • SHARE
X
Request Customization
Speak to Analyst
Speak to Analyst
OR FACE-TO-FACE MEETING
PERSONALIZE THIS RESEARCH
  • Triangulate with your Own Data
  • Get Data as per your Format and Definition
  • Gain a Deeper Dive on a Specific Application, Geography, Customer or Competitor
  • Any level of Personalization
REQUEST A FREE CUSTOMIZATION
LET US HELP YOU!
  • What are the Known and Unknown Adjacencies Impacting the Medical Equipment Maintenance Market
  • What will your New Revenue Sources be?
  • Who will be your Top Customer; what will make them switch?
  • Defend your Market Share or Win Competitors
  • Get a Scorecard for Target Partners
CUSTOMIZED WORKSHOP REQUEST
  • Call Us
  • +1-888-600-6441 (Corporate office hours)
  • +1-888-600-6441 (US/Can toll free)
  • +44-800-368-9399 (UK office hours)
CONNECT WITH US
ABOUT TRUST ONLINE
©2024 MarketsandMarkets Research Private Ltd. All rights reserved
DMCA.com Protection Status Website Feedback